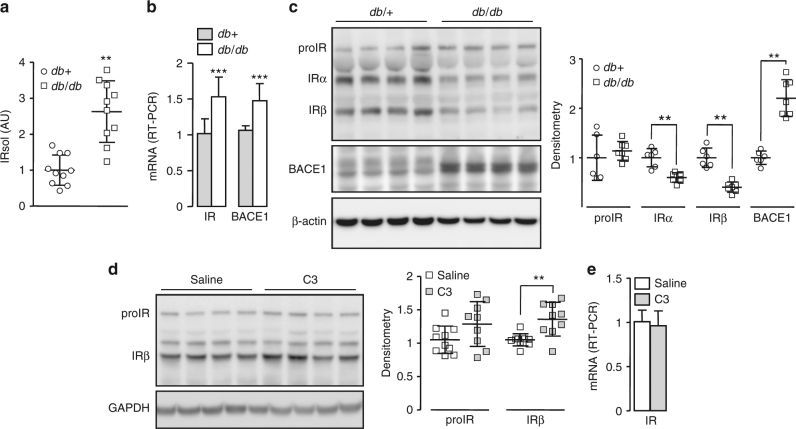
Fig. 8.
IR cleavage in a mouse model of diabetes. a IRsol was measured in the plasma from db/db mice (n = 10) and from their control littermate (db/+; n = 10). b mRNA levels of IR and BACE1 were measured by RT-PCR in the liver. c Liver expression of IR, BACE1, and β-actin (loading control) were analyzed by immunoblot; a densitometric analysis of the proIR, IRα, IRβ, and BACE1 bands was performed (right), values are expressed as fold over the means of the wild-type mice. d db/db mice were treated with saline or with BACE1 inhibitor (C3, 4 weeks), then liver expression of IR and GAPDH (loading control) were analyzed by immunoblot; a densitometric analysis of the proIR and IRβ bands was performed (right). e mRNA levels of IR were measured by RT-PCR in the liver of db/db mice treated with saline or with the BACE1 inhibitor (C3). Data are means ± s.d. Statistical analyses were made using unpaired t-test. **p < 0.01; ***p < 0.001

