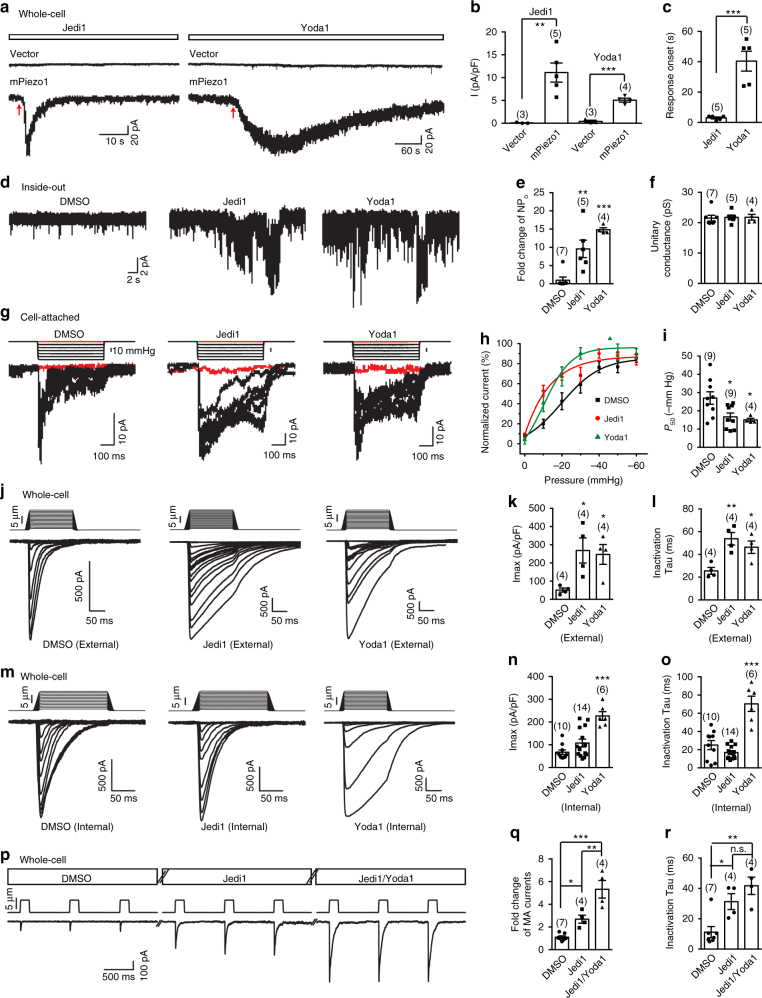
Fig. 3.
Electrophysiological effects of Jedi1 and Yoda1 on Piezo1. a Representative whole-cell current traces in response to either 1 mM Jedi1 or 30 μM Yoda1, which was puffed onto the recorded cells. The red arrows indicate the onset of the current. b, c Scatter plot of the current amplitudes (b) or onset (c) induced by the compound. Statistical significance was assessed using the unpaired Student’s t-test. d Representative channel activities of mPiezo1-expressing cells in the inside-out patch configuration at −80 mV. The compounds were in the pipette solution. e, f Scatter plot of the NPo (e) or unitary conductance (f). Statistical significance was assessed using one-way ANOVA with Dunn’s comparison to DMSO. g Representative stretch-activated currents at −80 mV from mPiezo1-expressing cells. The red traces show the single-channel activities in the absence of externally applied force (Supplementary Fig. 1d). h Pressure-current relationships fitted with a Boltzmann equation. i Scatter plot of the P50 calculated from fit of the pressure-current relationship of individual recordings with a Boltzmann equation. Statistical significance was assessed using one-way ANOVA with Dunn’s comparison to DMSO. j, m Representative traces of poking-induced inward currents at −60 mV with the indicated compound present either in the extracellular (j) or internal (m) recording buffer. k, n Scatter plot of the maximal poking-induced currents. Statistical significance was assessed using one-way ANOVA with Dunn’s comparison to DMSO. l, o Scatter plot of the inactivation Tau of the poking-induced currents. Statistical significance was assessed using one-way ANOVA with Dunn’s comparison to DMSO. p Three consecutive poking-induced current traces that reached the steady state under DMSO, 200 μM Jedi1, and 200 μM Jedi1/30 μM Yoda1, respectively, are shown. q, r Scatter plot of the fold change (q) or inactivation tau (r) of the poking-induced currents. Statistical significance was assessed using one-way ANOVA with Tukey’s multiple comparisons test. Each bar represents mean ± s.e.m., and the recorded cell number is labeled above the bar. ***P < 0.001, **P < 0.01, *P < 0.05

