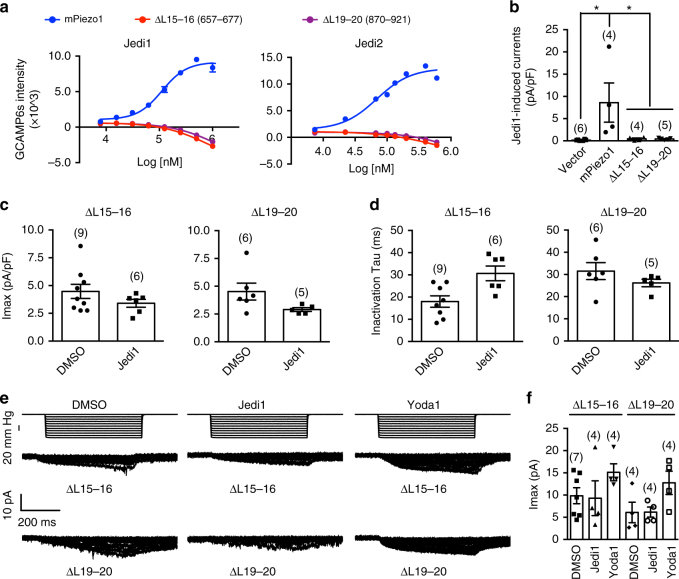
Fig. 5.
L15-16 and L19-20 are essential for Jedi activation of Piezo1. a Dose response curves of HEK293T cells transfected with GCAMP6s and the indicated constructs in response to the specified compounds as assayed by FLIPR. The curves were fitted with a Boltzmann equation. Each data point represents mean ± s.e.m., n = 4 wells. b Scatter plot of the chemical-induced currents from Piezo1-KO-HEK cells transfected with the indicated constructs. Statistical significance was assessed using one-way ANOVA with multiple comparison. c Scatter plot of the poking-induced Imax. Statistical significance was assessed using unpaired, two-tailed Student’s t-test. d Scatter plot of the inactivation tau of the poking-induced currents. Statistical significance was assessed using unpaired, two-tailed Student’s t-test. e Representative stretching-activated currents of cells recorded at −80 mV. f Scatter plot of the maximal stretching-activated currents. Statistical significance was assessed using one-way ANOVA with Dunn’s comparison to the DMSO-treated group. Each bar represents mean ± s.e.m., and the recorded cell number is labeled above the bar. *P < 0.05

