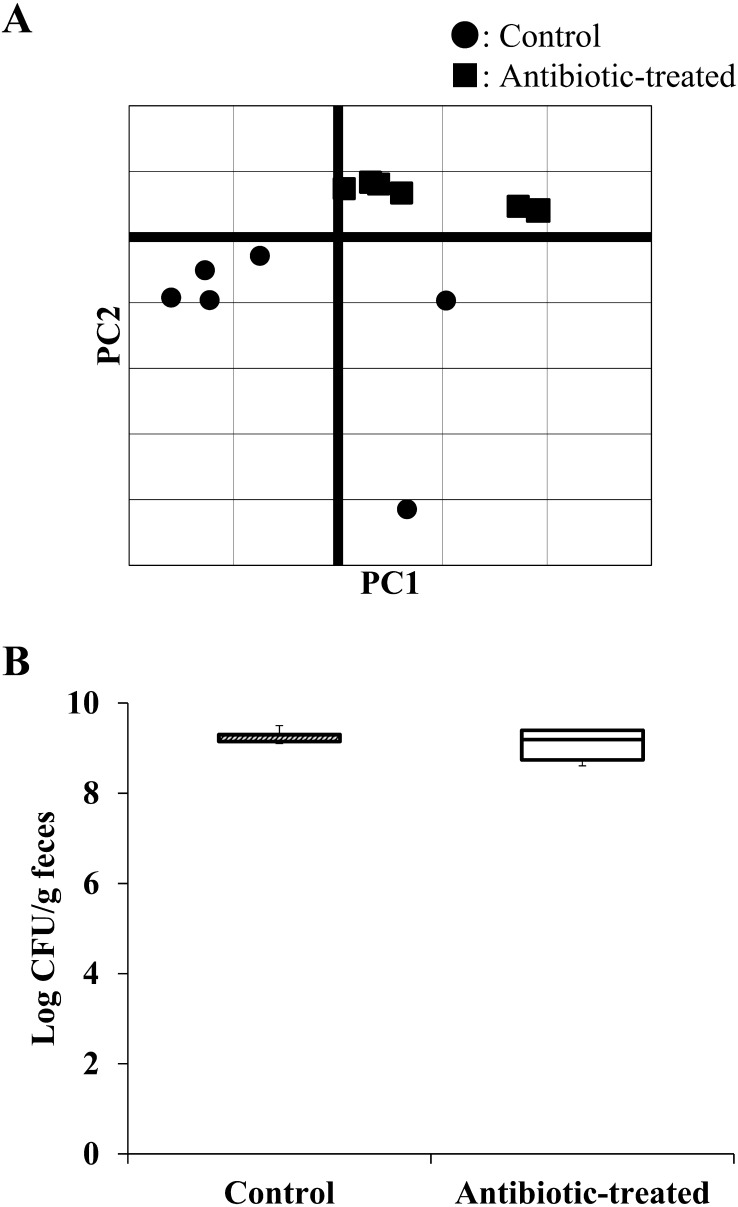
Fig. 2.
Principal component analysis (PCA) by metagenomic analysis and CFU in feces of each group. Analysis results by PCA showed the composition of the intestinal microbiota of each mouse as the first principal component (PC 1) on the horizontal axis and the second principal component (PC 2) on the vertical axis (A). The total number of fecal samples in each group was measured by the anaerobic culture method using GAM medium. The graph shows the log CFU/g of each group (B) (n=6).

