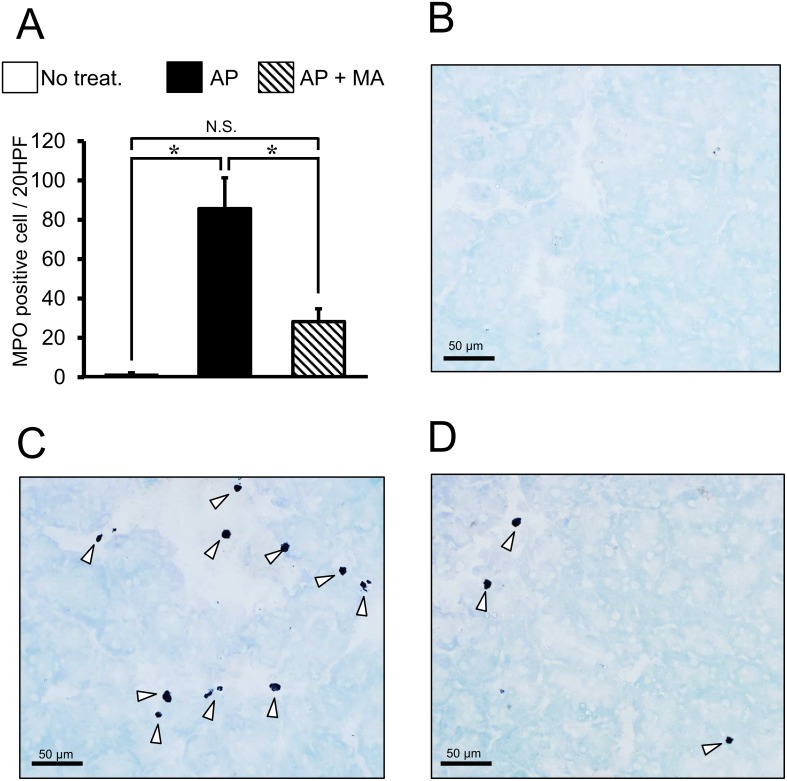
Fig. 3.
Effect of maropitant on the number of MPO positive cells in AP. A: Results of MPO staining in each treatment group (n=8, each). *P<0.05; N.S., not significant. The arrowheads indicate MPO positive cells in the pancreas. AP, acute pancreatitis; MA, maropitant; MPO, myeloperoxidase. B: histological finding of no treated mice. C: histological finding of AP mice. D: histological finding of AP mice treated with maropitant.

