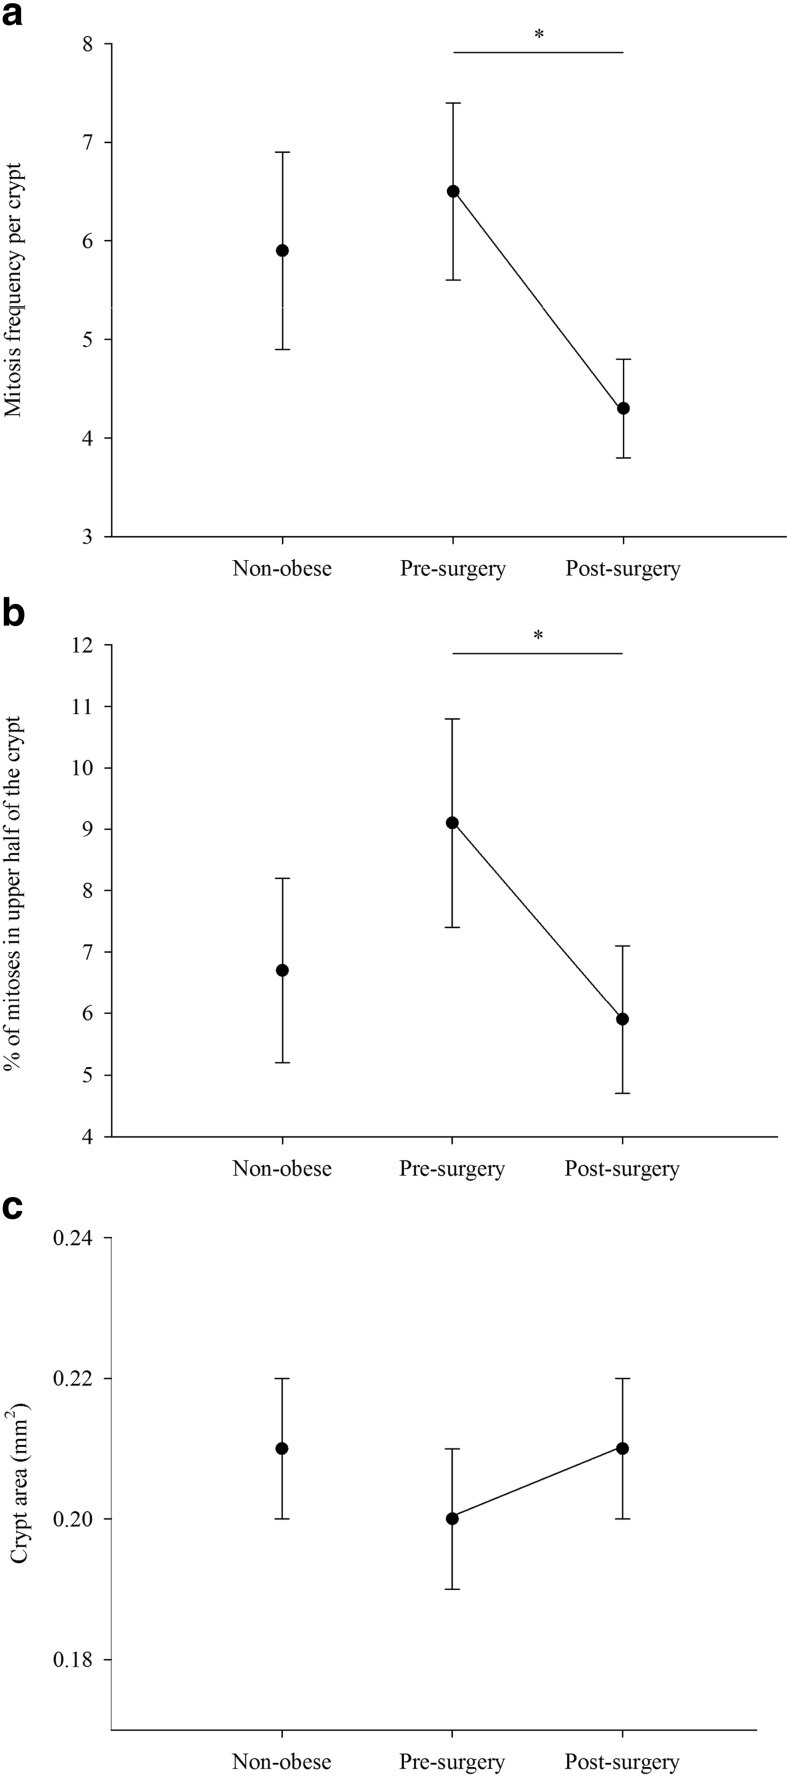
Fig. 2.
Rectal mucosal crypt cell proliferation status in non-obese control participants and in obese participants pre- and post-RYGB surgery. a Mean total number of mitoses per crypt. b Percentage of mitoses in the upper half of the crypt. c Mean crypt area. Dark circles represent mean for the group and error bars represent standard error. Independent sample t test used to compare non-obese control and obese pre-surgery participants. Paired sample t test used to compare obese participants pre- and post-surgery (*p < 0.05)

