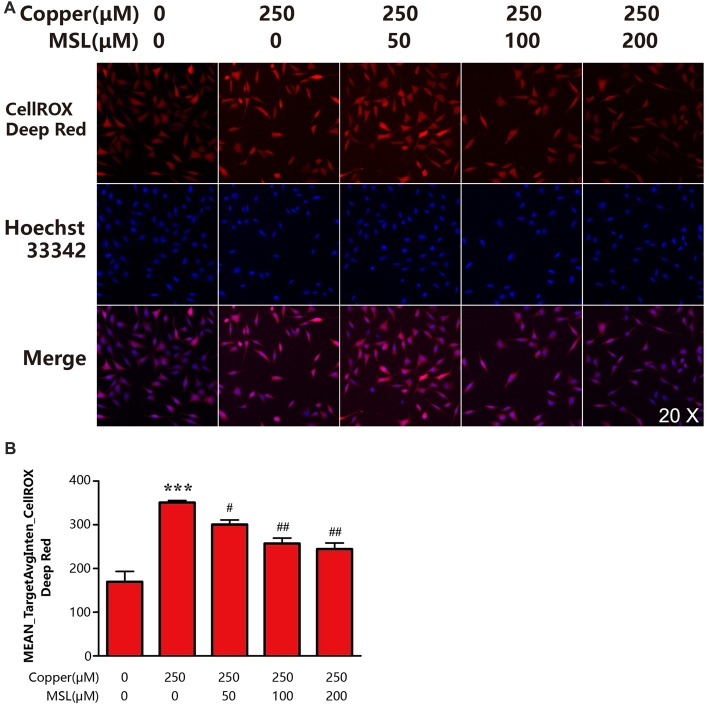
Figure 5.
MSL inhibited the production of intracellular reactive oxygen species (ROS) in APPsw cells. (A) Fluorescent images of CellROX Deep Red representing ROS production. Fluorescent images and intensities were analyzed by a Cellomics ArrayScan high-content screening (HCS) Reader and software. (B) Quantified values of CellROX Deep Red was analyzed by Mean_Avginten. Data are expressed as the mean ± SEM, n = 6, ***p < 0.001 vs. untreated cells; #p < 0.05, ##p < 0.01 vs. copper-treated cells.

