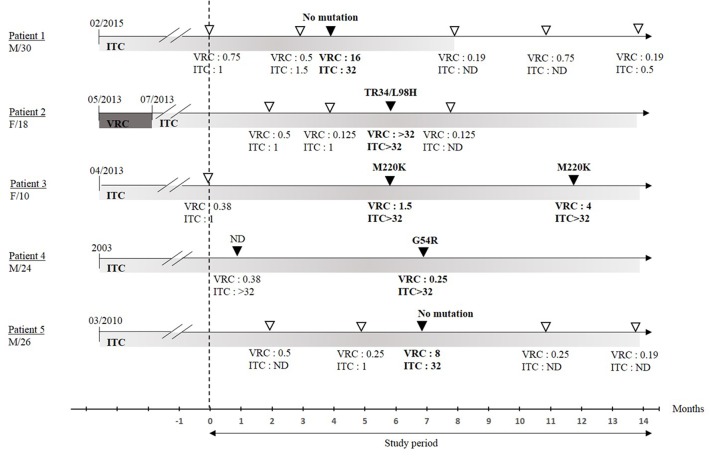
FIGURE 2.
Date of treatment onset and time frame of sample collection over the study period. Isolates susceptible to azole are represented by open triangles, isolates resistant to at least one azole are represented by black triangles. Respective MIC values (mg/L) are indicated. MIC, minimum inhibitory concentration; ITC, itraconazole; VRC, voriconazole; ND, not determined; F, female; M, male; /n, age in years. Susceptibility testing was performed only from 09/2015.

