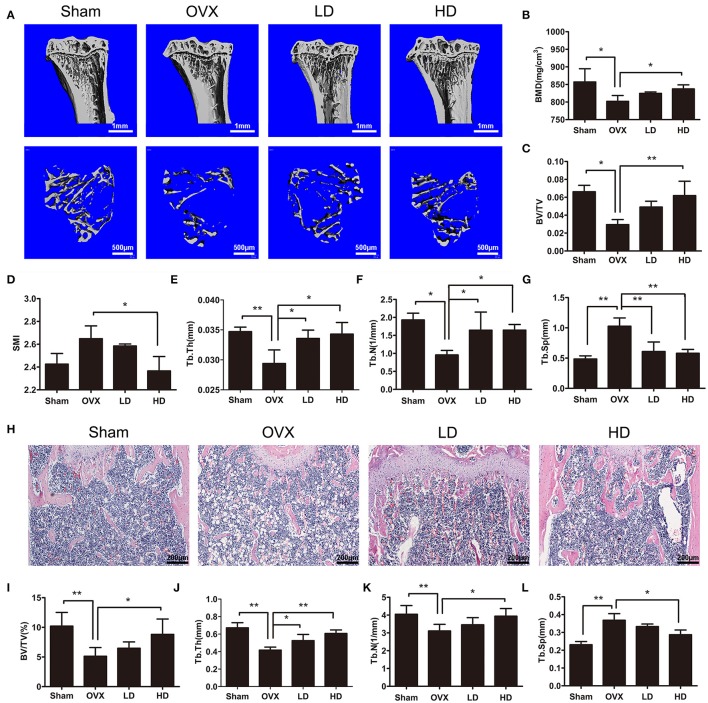
Figure 1.
CEP prevented OVX-induced bone loss in vivo. (A) Representative 3D micro-CT images of trabecular bone of proximal tibias from each group were reconstructed. Scale bar = 1 mm and 500 μm (B–G) The BV/TV, Conn.D, SMI, Tb.N, Tb.Th, and Tb.Sp values of micro-CT data from each sample were obtained and analyzed (H). H&E staining was performed for the histomorphological analysis. Scale bar = 200 μm (I–L) The BV/TV, Tb.N, Tb.Th, and Tb.Sp values of histomorphological sections were measured and quantified. LD and HD represent the dose of 5 and 20 mg/kg CEP, respectively. Values are expressed as mean ± SD, n = 10; *P < 0.05, **P < 0.01 vs. the control group.

