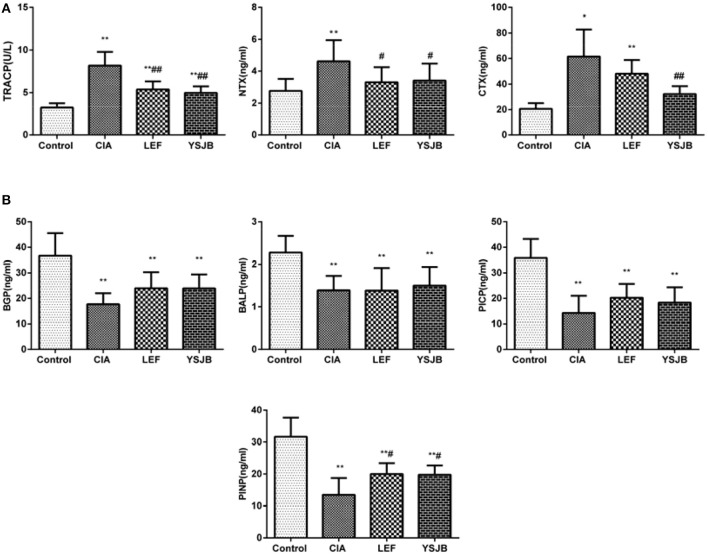
Figure 4.
Regulation of bone markers after treated with YSJB in CIA rats. (A) Bar plots represented the markers of bone resorption with TRACP, NTX and CTX. (B) Bar plots represented the markers of bone formation with BGP, BALP PICP and PINP. The data are presented as means ± SD. *P < 0.05, **P < 0.01 compared with control group. #P < 0.05, ##P < 0.01 compared with CIA group.

