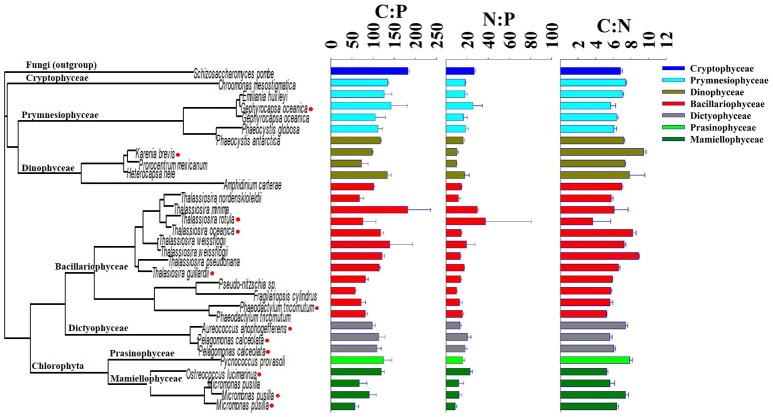
Figure 2.
Phylogenetic tree of the 18S rRNA sequence of 30 eukaryotic phytoplankton isolates in comparison with the molar ratio of cellular elements of carbon, nitrogen, and phosphorus. Red markers on the tree indicate isolates that were sequenced by Laragen, Inc., vs. others that were collected from the National Center for Biotechnology Information database.

