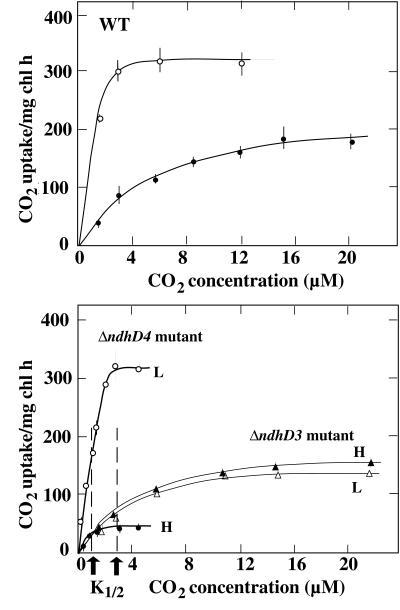
Figure 3.
The rate of CO2 uptake by H cells (closed symbols) and L cells (open symbols) of the WT (circles, Upper) and mutant strains of Synechocystis PCC 6803, ΔndhD3 (triangles) and ΔndhD4 (circles, Lower), as a function of CO2 concentrations in the medium. The CO2 concentration in the medium in equilibrium with the gas containing 300 μl CO2/liter was taken as 9.2 μM at 30°C. Other conditions were as in Fig. 2.

