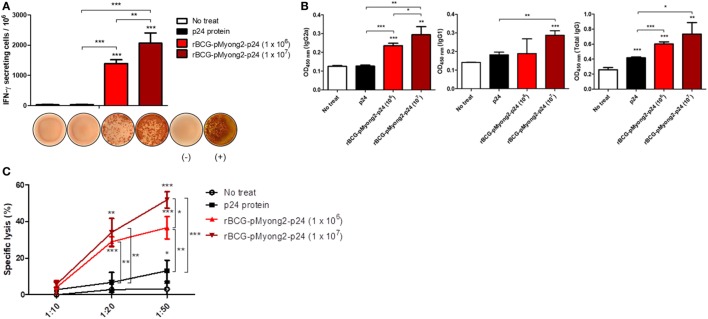
Figure 7.
Comparison of the p24-specific immune responses by injections of p24 protein and different M.O.I. of recombinant Mycobacterium bovis BCG (rBCG)-pMyong2-p24 strains. (A) Comparison the IFN-γ secretion levels following in vitro stimulation of splenocytes from mice (three mice/group) injected subcutaneously with the p24 protein (30 μg/mouse) and different colony forming units (CFUs) (1 × 10⁶ and 1 × 10⁷ CFU) of rBCG-pMyong2-p24 strain (1 week interval, twice injection) were detected using an ELISPOT analysis. Representative images of ELISPOT membrane in each group are shown below the graph. (−), negative control; (+), positive control. Data are shown with Mean ± SD in triplicate. **P < 0.01; ***P < 0.001 (Student’s t-test). (B) p24-specific immunoglobulin subtypes (IgG2a, IgG1, and total IgG) were detected by enzyme-linked immunosorbent assay. Serum samples from three mice per group were analyzed. Data are shown with Mean ± SD in triplicate. *P < 0.05; **P < 0.01; ***P < 0.001 (Student’s t-test). (C) Cytotoxic T lymphocyte responses due to the reaction of splenocytes (stimulated with A9I, p24 epitope peptide; effector cells) from p24 protein and rBCG-pMyong2-p24 injected mice and A9I peptide pulsed P815 cells (target cells). Three mice per group were analyzed. Data are shown with Mean ± SD in triplicate. *P < 0.05; **P < 0.01; ***P < 0.001 (Student’s t-test).

