
FIGURE 3.
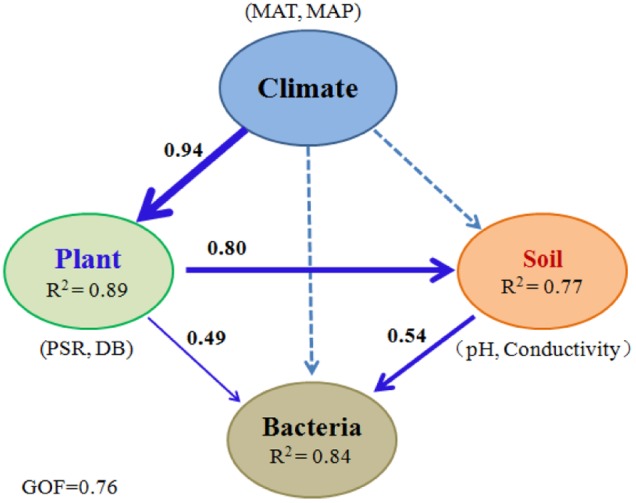
Direct and indirect effects of climate, vegetation, and soil attributes on bacterial communities. PLS-PM was performed for bacterial communities in 99 soil samples collected along the elevational gradients. The width of arrows is proportional to the strength of path coefficients. Continuous and dashed arrows indicate significant and nonsignificant relationships, respectively. R2 denotes the proportion of variance explained. MAT, mean annual air temperature; MAP, mean annual precipitation; PSR, plant species richness; DB, the percentage of total DBH for DB trees.