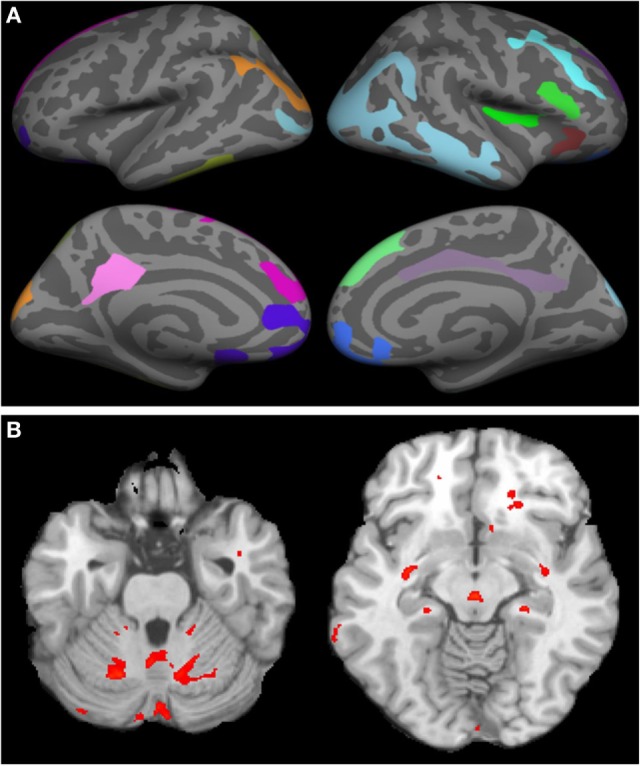
Figure 2.

Cortical thinning and regional atrophy analyses. (A) Volumetric MRI. Left (first column) and right (second column) hemispheres showing cortical thinning in West Nile infected individuals as compared to a database of MRIs from healthy controls with lateral (top row) and medial (bottom row) views. Colored regions indicate areas of thinning. In the left hemisphere, parts of the posterior cingulate cortex (pink), parts of the superior frontal cortex and medial-orbito frontal region (magenta), anterior cingulate cortex and inferior frontal cortex (violet blue), parts of the cuneus (orange) and para hippocampal region (pale green) were identified. In the right hemisphere, parts of the middle and inferior temporal cortex, and supramarginal region (light blue), inferior frontal region and insular cortex (bright green and red), parts of the superior frontal cortex (light green, blue, and violet), cingulate cortex (light purple), and inferior frontal region (blue) were identified. (B) Tensor-based morphometry (TBM) analysis of regional atrophy. Regions with regional atrophy as detected by TBM are identified in red.
