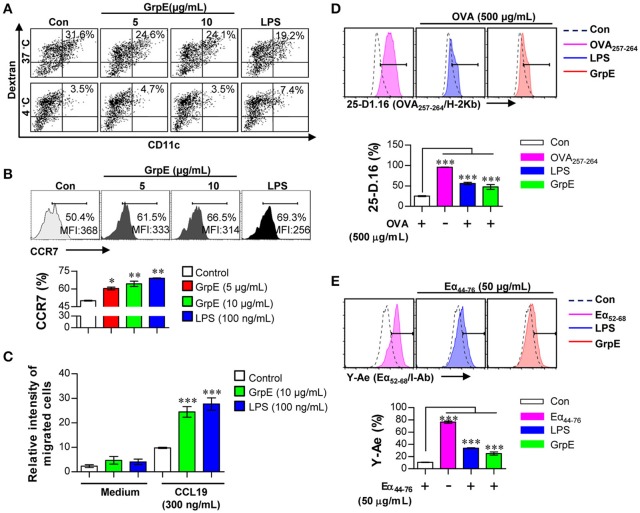
Figure 2.
Ag uptake, migration, and Ag presentation capability of DCs by GrpE treatment. (A–C) DCs were treated with GrpE or LPS for 24 h. (A) Cells were incubated with dextran-FITC at 37 and 4°C for 30 min, and assessed by flow cytometry. The percentages of dextran+CD11c+ cells are indicated. One representative plot from three independent experiments is shown. (B) CCR7 expression in DCs (on gated CD11c+) was analyzed by flow cytometry. (C) DCs were treated with GrpE and the relative intensity of migrated cells was identified through CCL19. Bar graphs display mean ± SD (n = 3 samples) and statistical significance (*p < 0.05, **p < 0.01, or ***p < 0.001) is shown for treatments compared to non-treated DCs (Control). (D,E) DCs were treated with LPS or GrpE, and then pulsed with OVA protein or Eα44–76 peptide. After 24 h, cells were stained with anti-CD11c, anti-25-D1.16, or anti-Y-Ae mAbs. Histogram and bar graphs for expression of OVA257–264/H-2Kb (D) and Eα52–68/I-Ab complexes (E) are displayed. OVA257–264 or Eα52–68 peptide (each peptide; 2 μg/mL concentration) was used as a positive control for antigen presentation. Histogram data are representative result of three experiments. Bar graph data is expressed as the mean ± SD (n = 3 samples); ***p < 0.001; Con denotes untreated DCs.

