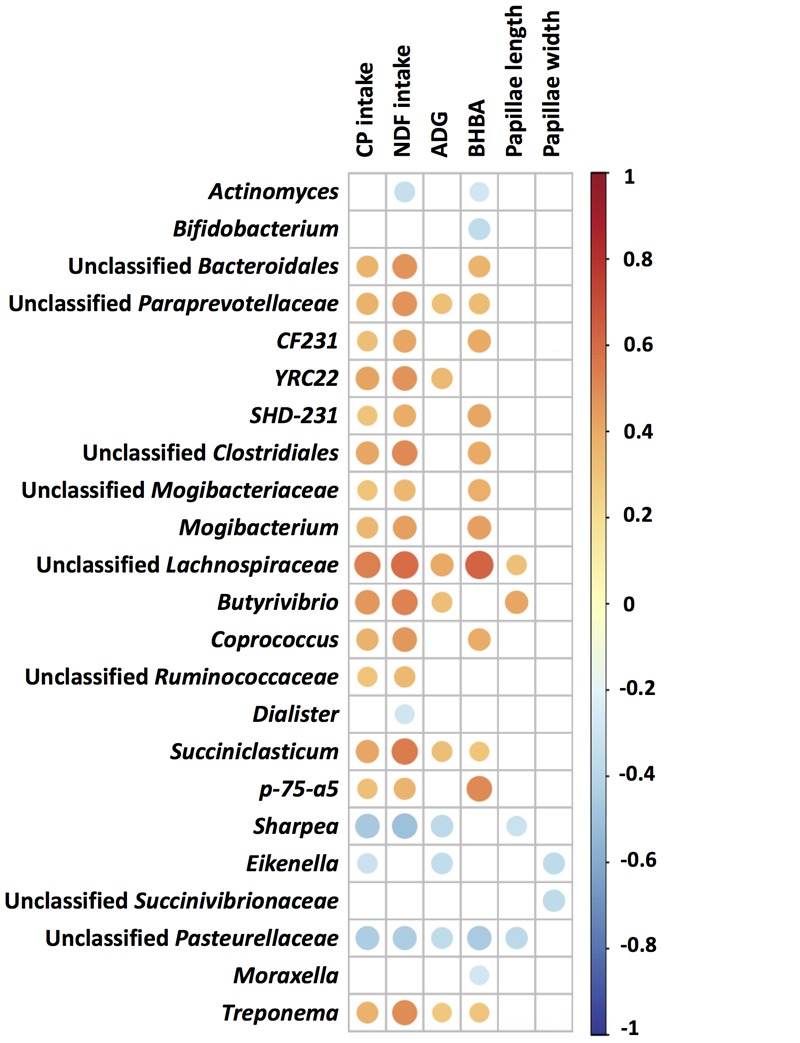
FIGURE 4.

Spearman’s correlation between the rumen bacterial communities (genus level) and phenotypic variables. The color and dot size represent the correlation coefficient. Red represents a positive correlation, and blue represents a negative correlation; a larger dot size represents a stronger correlation, and a smaller dot size represents a weaker correlation. CP, crude protein; NDF, neutral detergent fiber; ADG, average daily gain; BHBA, β-hydroxybutyrate.
