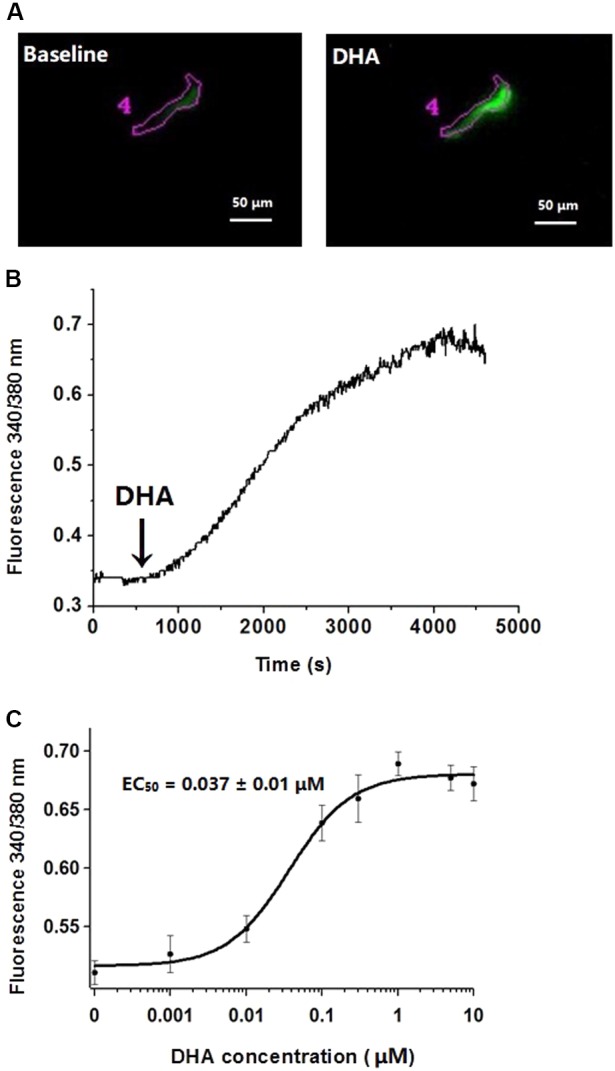
FIGURE 4.

Effects of different concentrations of DHA on cytosolic calcium concentrations. (A) Representative changes of fluorescence intensity of F340 at baseline and after exposure 1 μM of DHA in rat CASMCs loaded with Fura-2/AM. (B) Representative changes of DHA-induced fluorescence intensity ratios. (C) Concentration–response relationships showing the effects of DHA on fluorescence intensity ratios, n = 5–8 cells.
