FIGURE 5.
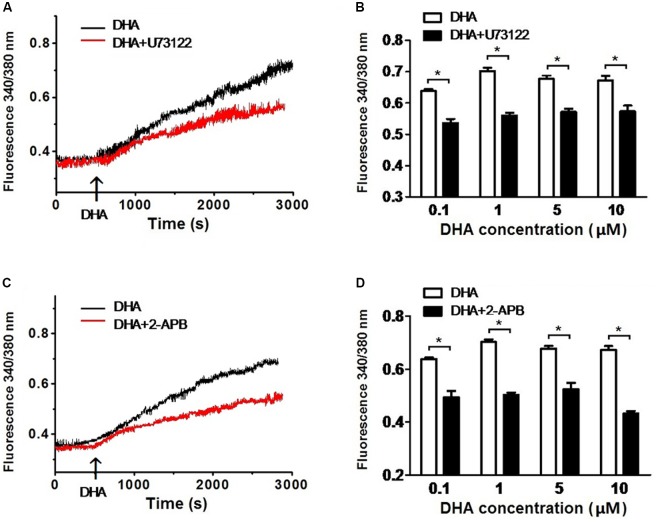
DHA induces the increase of [Ca2+]i via PLC–IP3 signal pathway. (A) Representative recordings of DHA-induced fluorescence intensity ratios in rat CASMCs with or without U-73122 pre-incubation. (B) Group data in bar graphs showing fluorescence intensity ratios after exposure to 0.1, 1, 5, and 10 μM of DHA in rat CASMCs with or without U-73122 pre-incubation, n = 5–8 cells, ∗P < 0.05 U-73122 vs. control. (C) Representative recordings of DHA-induced fluorescence intensity ratios in rat CASMCs with or without 2-APB pre-incubation. (D) Group data in bar graphs showing fluorescence intensity ratios after exposure to 0.1, 1, 5, and 10 μM of DHA in rat CASMCs with or without 2-APB pre-incubation, n = 5–8 cells, ∗P < 0.05 2-APB group vs. control group.

