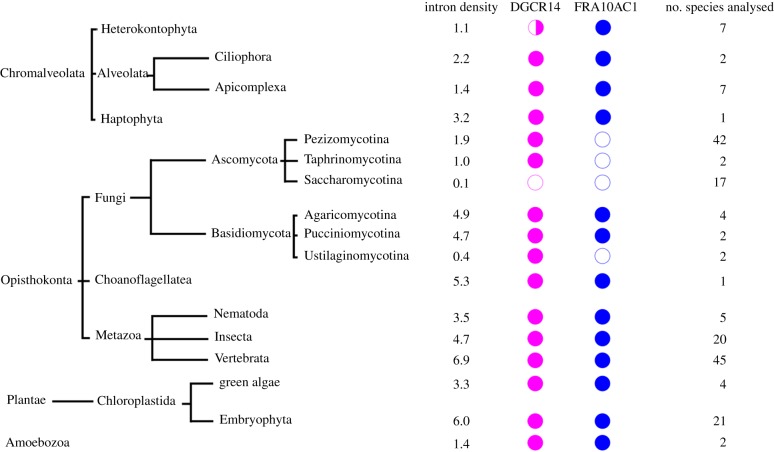
Figure 6.
Distribution of orthologues of DGCR14 and FRA10AC1 in multiple eukaryotic kingdoms. The median intron density (per 1 kb coding region) in each class is calculated from Rogozin et al. [43]. Open circles, protein absent from the class; half closed circles, protein absent from some species within the class; closed circles, protein present in the class. The lengths of branches do not represent evolutionary distance. The numbers of species analysed in each class are indicated on the right.

