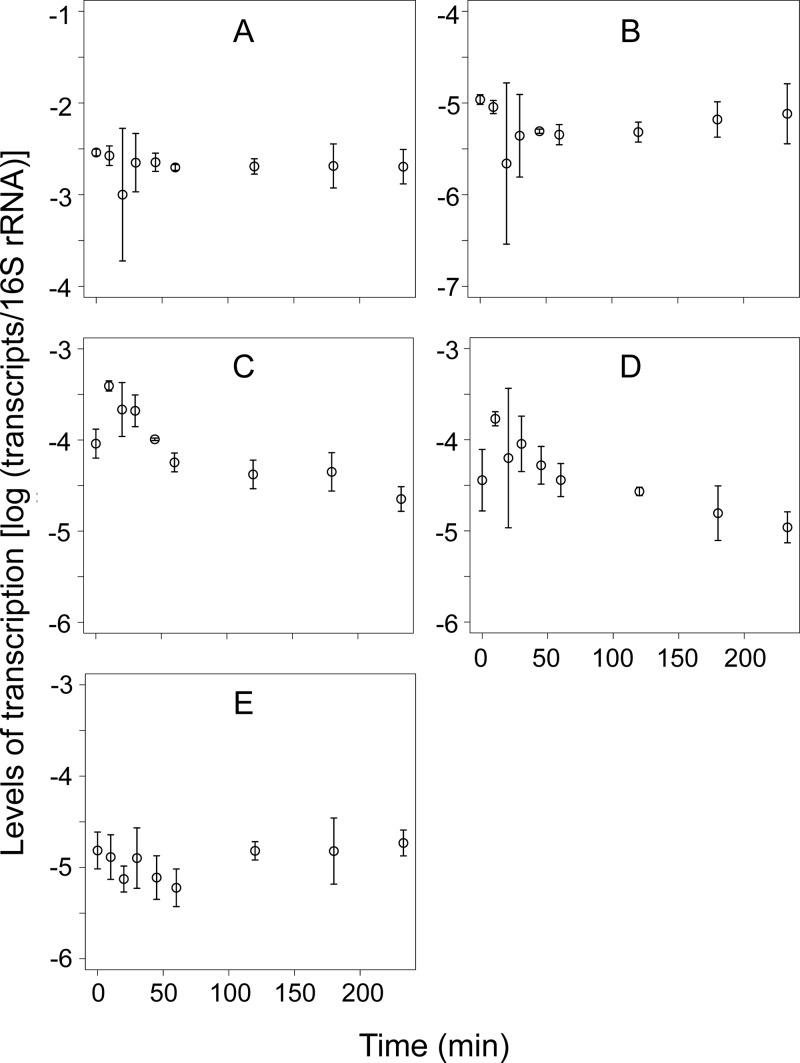
FIG 5.
Quantities of gene transcripts of amoA (A), N. europaea- and N. eutropha-specific nirK (B), nirS (C), cnorB (D), and nosZ clade I (E), obtained from the nitrification-denitrification granules as measured by the NiCE chip assay. Means ± standard deviations of data from triplicate granule samples are shown.

