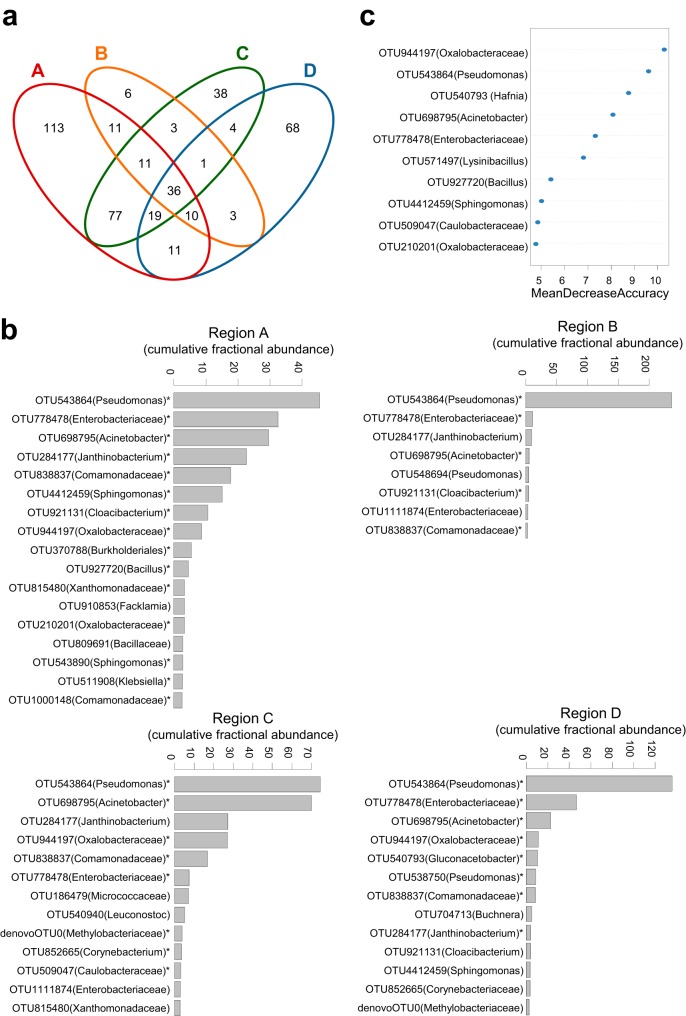
FIG 2.
Core members of the bacterial communities. (a) Venn diagram showing shared OTUs in the four farming regions (A to D). (b) Rank abundance plots showing dominant OTUs (average relative abundance, ≥1%) in the four farming regions. Asterisks indicate the OTUs found in at least ≥50% of the samples within each region. (c) OTUs that discriminate farming regions were determined using random forest analysis. A higher mean decrease in accuracy indicates that an OTU makes a greater contribution to the accuracy of the random forest classification.

