


FIG 2.
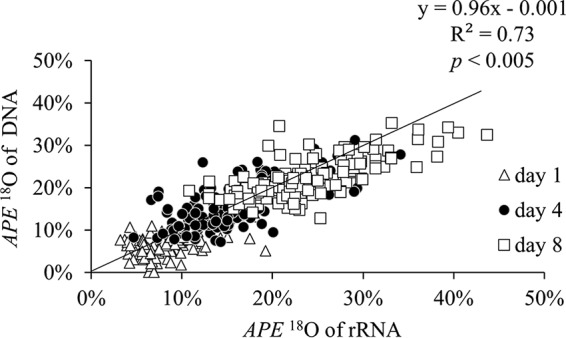
Correlation between atom percent excess (APE) 18O values of DNA and rRNA among soil taxa on days 1, 4, and 8. The equation shown is for the overall regression, which includes all time points. The black line represents a 1:1 ratio, where the APE 18O of DNA and rRNA are equal.