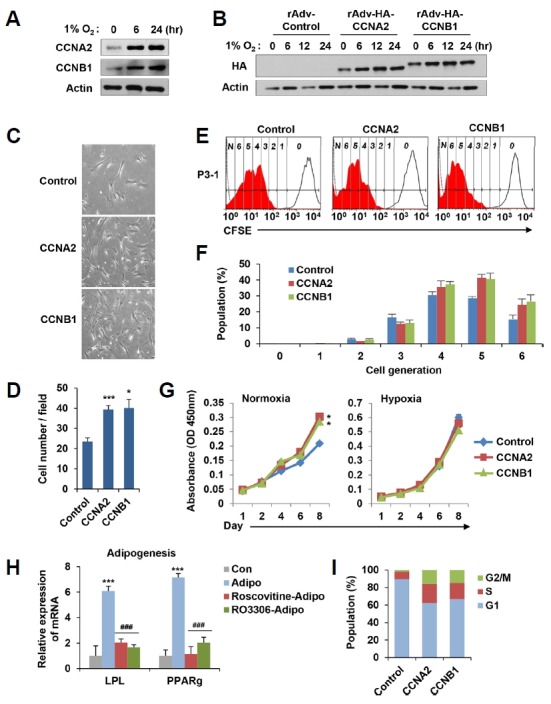
Fig. 3. Overexpression of mitotic cyclins in normorxic condition activates the proliferation potential of MSCs.

(A) MSCs were grown in hypoxic condition (1% O2) for the indicated time and immunoblotted with anti-CCNA2 or anti-CCNB1 antibody. (B) Generated recombinant adenovirus expressing hemagglutinin (HA)-tagged human CCNA2 (rAdv-HA-CCNA2) and CCNB1 (rAdv-HA-CCNB1) were infected into MSCs in conjugation with cell penetrating peptide PTD. Infected cells were grown in hypoxic condition (1% O2) and immunoblotted with anti-HA antibody. (C, D) rAdv-HA-CCNA2 and rAdv-HA-CCNB1 were infected to MSCs at passage 3, which were further cultured in normoxic condition for an additional three rounds of division. The figure shows the representative phase contrast images of MSCs (C). The graph showed the average number of cells per fields for each group. (D). (E, F) MSCs were infected with rAdv-HA-CCNA2 or rAdv-HA-CCNB1, labeled with CFSE, and further cultured in normoxic condition for an additional three rounds of division. An open histogram indicates a control MSCs (non CFSE labeled MSCs, 0), and the closed histogram indicates a proliferating MSCs (CFSE labeled MSCs, 1–6). Numbers (0 to 6) depicts the dividing number of MSCs according to serial 2-fold decreases of fluorescence intensity (E). The graphs show the percentage population of each dividing number of MSCs above (F). (G) rAdv-HA-CCNA2- or rAdv-HA-CCNB1-infected MSCs cells (at passages 4) were cultured in normoxic and hypoxic conditions, and at indicated days cell proliferation was determined by the WST-1 assay. (H) MSCs grown in hypoxic condition were forced to be differentiated into adipocytes (Adipo) in the presence of Roscovitine (10 μM, Adipo-Roscovitine) or RO3306 (10 μM, Adipo-RO3306) treatment for 2 weeks. The levels of LPL and PPARg mRNA were measured by qRT-PCR. ‘Cont’ indicates undifferentiated MSCs. (I) MSCs were infected with rAdv-HA-CCNA2 or rAdv-HA-CCNB1, cultured in normoxic condition, and harvested for propidium iodide staining to measure their DNA contents. The graphs show the percentage population of each phase of cell cycle. The all results represent mean values ± SEM. *P < 0.05 and ***P < 0.001 versus control and ###P < 0.001 versus adipogenesis.
