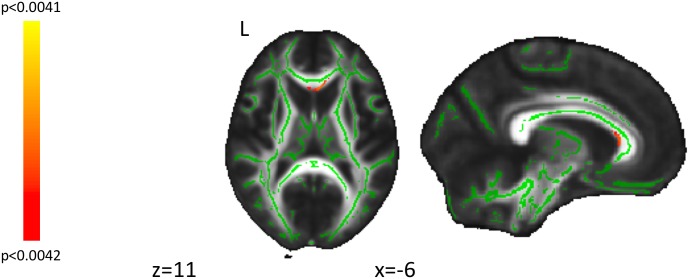
FIGURE 2.
Displayed are findings from correlations of the quest openness-to-change subscale scores and perpendicular diffusion (λT) values thresholded at p-value corrected using threshold-free cluster enhancement (pTFCE) at <0.0042. Significant voxels at a cluster threshold for whole-brain significance (k = 221) are shown in red. Green represents the center of white-matter tracts, as defined using the FMRIB58_FA_skeleton mask. L, left.

