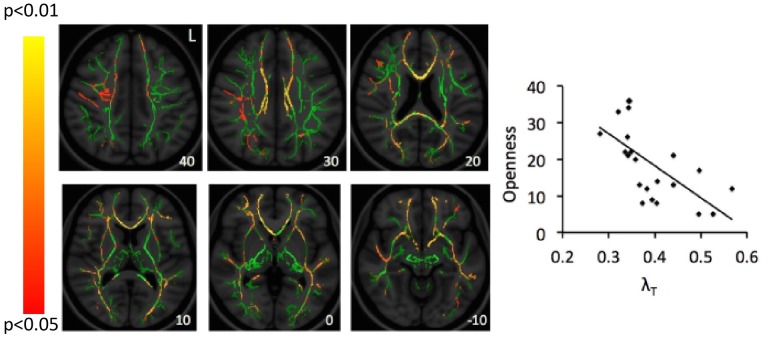
FIGURE 3.
Correlations between scores on the openness-to-change measure and λT values. Red-yellow color on the Montreal Neurological Institute (MNI) T1 template indicates brain regions exhibiting significant correlations between scores of openness to change religious beliefs and λT values. For illustration, scatter-plots demonstrate correlations between scores of openness to change religious beliefs (Openness; y-axis) and mean λT values averaged across all clusters identified as significant in the whole-brain analysis. The number at the left bottom of each brain image indicates the z coordinate in the MNI space. L, left.

