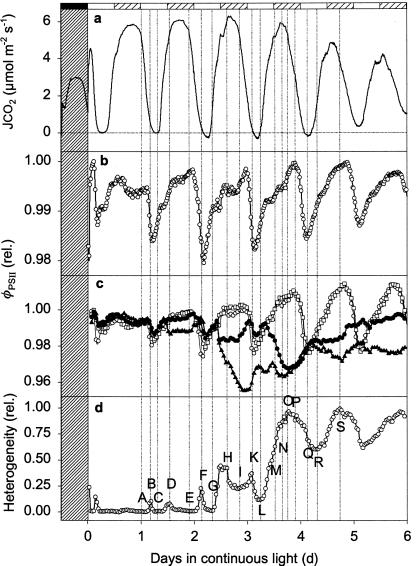
Figure 3.
Endogenous rhythm of net CO2 exchange (a) and φPSII averaged over the entire leaf (b) in continuous light. In c, four separate patches (3 × 3 mm square) were monitored over time. The open symbols correspond to two patches in the center of the leaf, and the closed symbols correspond to two patches at the leaf base. In d, heterogeneity is quantified as described in Fig. 1. Experimental conditions were the same as in Fig. 1, but leaf temperature was 21°C and light-intensity 194 μmol photons m−2⋅s−1. Hatched bars indicate where a dark period would occur in normal day/night cycle.

