
FIGURE 1.
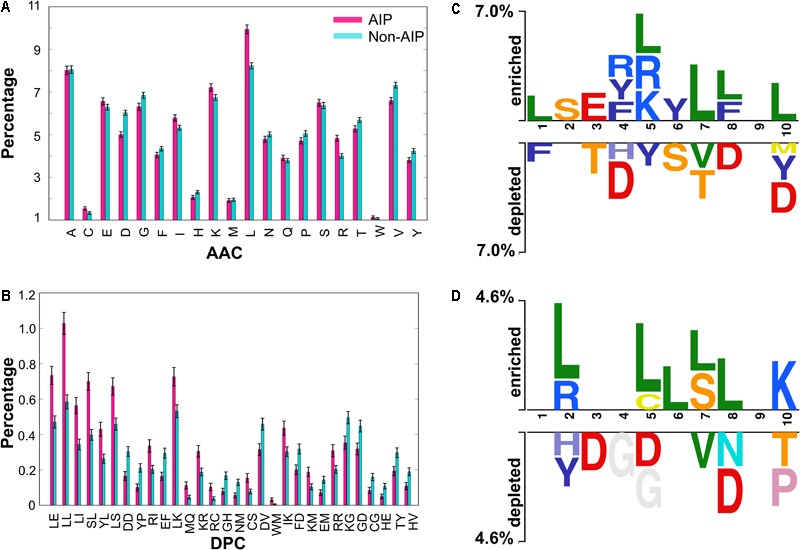
Compositional and positional preference analysis. (A) and (B) respectively represent the amino acid and dipeptide preferences between AIPs and non-AIPs. (B) Significant differences in top-30 dipeptides are shown. (C,D) Represent positional conservation of ten residues at N- and C-terminal between AIPs and non-AIPs, respectively, generated using two sample logos.