
FIGURE 6.
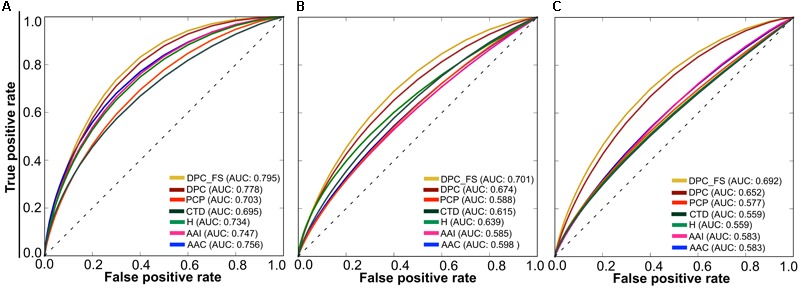
A graphical illustration to show the performance of various ML models in terms of ROC curves obtained from the 5-fold cross-validation. (A) ERT; (B) SVM; and (C) k-NN.
Official websites use .gov
A
.gov website belongs to an official
government organization in the United States.
Secure .gov websites use HTTPS
A lock (
) or https:// means you've safely
connected to the .gov website. Share sensitive
information only on official, secure websites.
A graphical illustration to show the performance of various ML models in terms of ROC curves obtained from the 5-fold cross-validation. (A) ERT; (B) SVM; and (C) k-NN.