
FIGURE 7.
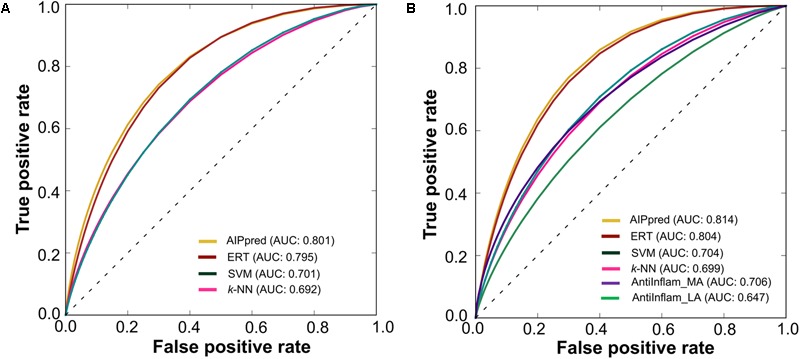
Receiver operating characteristic curves of the various prediction models. (A) 5-fold cross-validation on a benchmarking dataset and (B) independent dataset. Higher AUC values indicated better method performance.
Official websites use .gov
A
.gov website belongs to an official
government organization in the United States.
Secure .gov websites use HTTPS
A lock (
) or https:// means you've safely
connected to the .gov website. Share sensitive
information only on official, secure websites.
Receiver operating characteristic curves of the various prediction models. (A) 5-fold cross-validation on a benchmarking dataset and (B) independent dataset. Higher AUC values indicated better method performance.