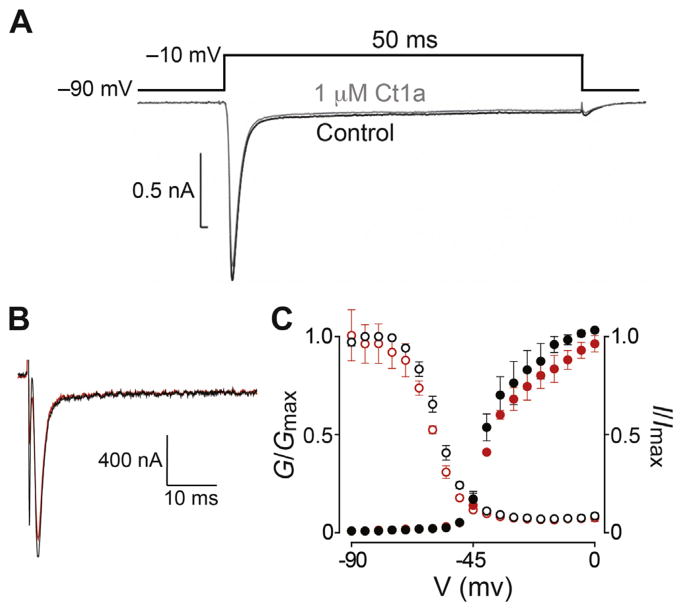
Fig. 5. Effect of Ct1a on insect NaV channels.
(A) Representative trace showing the lack of effect of Ct1a on NaV channel currents in P. americana DUM neurons recording using the whole-cell patch clamp technique. A standard test pulse to −10 mV from a holding potential of −90 mV (protocol shown above the traces) was used to elicit an inward INa represented by the superimposed traces before (black) and following a 5 min exposure (grey) to 1 μM Ct1a. The experiment was performed on three independent cells (n = 3). (B) Two-electrode voltage-clamp electrophysiology was used to examine the effect of Ct1a on BgNaV1 expressed in Xenopus oocytes. Shown are representative traces from a single oocyte, obtained from the −15 mV step of a conductance-voltage (G–V) step series (panel C), with the current before and after application of 1 μM Ct1a shown in black and red, respectively. (C) Normalized G–V relationship (G/Gmax, closed circles) and steady-state inactivation (SSI) relationship (I/Imax, open circles) before (black) and after (red) addition of 1 μM Ct1a. In both cases the toxin effect was normalized to control. Data are from two-electrode voltage-clamp of Xenopus oocytes expressing BgNaV1. Oocytes were depolarized in 5-mV increments from −90 mV to 5 mV for 50 ms from a holding potential of −90 mV, followed by a depolarizing pulse to −15 mV for 50 ms. Peak current from these step series was converted to conductance and normalized to generate the G–V relationship, while peak current from the −15 mV depolarization step was normalized to yield the SSI relationship. Data points are mean ± SEM (n = 3). (For interpretation of the references to colour in this figure legend, the reader is referred to the web version of this article.)

