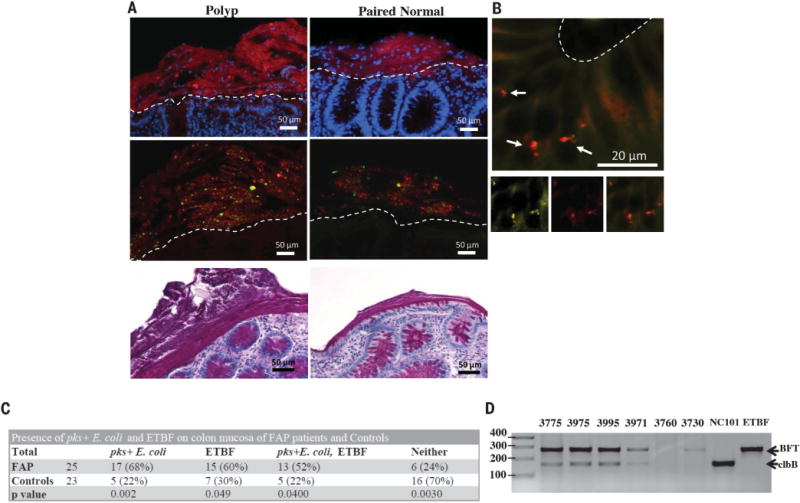
Fig. 1. Fluorescent in situ hybridization (FISH) and microbiology culture analysis of FAP mucosal tissues.

(A) Top panels: Representative FISH images of bacterial biofilms (red) on the mucosal surface of a FAP polyp and paired normal tissues counterstained with DAPI (4′,6-diamidino-2-phenylindole) nuclear stain (blue). Middle panels: Most of the biofilm composition was identified as B. fragilis (green) and E. coli (red) by using species-specific probes. Bottom panels: PAS (periodic acid–Schiff)–stained histopathology images of polyp and paired normal mucosal tissues demonstrating the presence of the mucus layer. Images were obtained at 40× magnification; scale bars, 50 μm. Dotted lines delineate the luminal edge of the colonic epithelial cells. Images are representative of n = 4 to 23 tissue samples per patient screened (at least 10 5-μm sections screened per patient). (B) Enterobacteriaceae (yellow) and E. coli (red) FISH probes on paired normal FAP tissue (100× magnification) revealing invasion into the epithelial cell layer at the base of a crypt (arrows). Bottom panels with insets of Enterobacteriaceae (bottom left panel) in yellow, E. coli (bottom middle panel) in red, and overlay (bottom right panel) confirming identification of the invasive species. Scale bar, 20 μm. Images are representative of n = 5 to 16 tissue samples per patient screened (at least 10 5-μm sections screened per patient). (C) FAP and control prevalence of pks+ E. coli and enterotoxigenic Bacteroides fragilis (ETBF). Chi-square P-values are shown that represent the difference in probability of detection of each bacterium in FAP versus control patients. (D) PCR detection of clbB (a gene in the pks island) and bft within laser-captured biofilms containing E. coli and B. fragilis from designated FAP patients (table S1) and controls (table S2; materials and methods). Data show a representative image from two independent experiments with two or three replicates per experiment performed.
