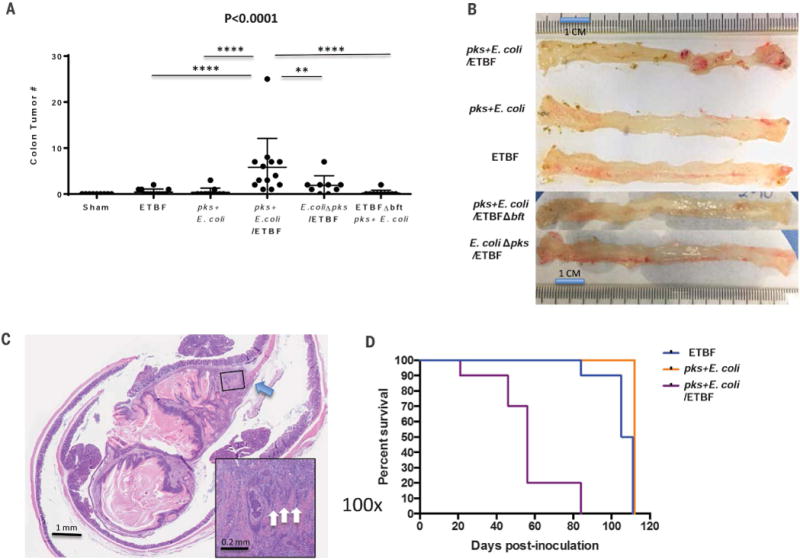
Fig. 2. Cocolonization by pks+ E. coli and ETBF increases colon tumor onset and mortality in murine models of CRC.

(A) Total colon tumor numbers detected in sham (n = 9), ETBF monocolonized (n = 12), pks+E. coli monocolonized (n = 11), pks+ E. coli/ETBF cocolonized (n = 13), E. coliΔpks/ETBF (n = 9), or pks+ E. coli/ETBFΔbft (n = 10) AOM mice at 15 weeks after colonization. Data indicate mean ± SEM. Overall significance was calculated with the Kruskal-Wallis test, and the overall P value is shown; Mann-Whitney U was used for two-group comparisons; **P = 0.016, ****P < 0.0001. (B) Representative colons of monocolonized (ETBF or pks+ E. coli), cocolonized (ETBF/pks+ E. coli), E. coliΔpks/ETBF, and pks+ E. coli/ETBFΔbft mice at 15 weeks after colonization of AOM-treated mice. Images are representative of n = 9 to 13 mice for each group. (C) H&E (hematoxylin and eosin) histopathology of an invasive adenocarcinoma in a cocolonized (pks+ E. coli/ETBF) AOM mouse at 15 weeks. Main image, 10× magnification; scale bar, 1 mm. Inset image, 100× magnification; scale bar, 0.2 mm. Blue arrow depicts the disruption of the muscularis propria by the invasive adenocarcinoma, and white arrows (inset) identify invading clusters of adenocarcinoma epithelial cells. (D) Kaplan-Meir survival plot of ApcΔ716Min/+ mice (n = 30) colonized with either ETBF (blue; n = 10), pks+ E. coli (orange; n = 10), or cocolonized with pks+ E. coli and ETBF (purple; n = 10). Cocolonization significantly (P < 0.0001) increased the mortality rate. Statistics were analyzed with the log-rank test. All surviving mice (n = 19) were harvested at 110 days.
