
Figure 2.
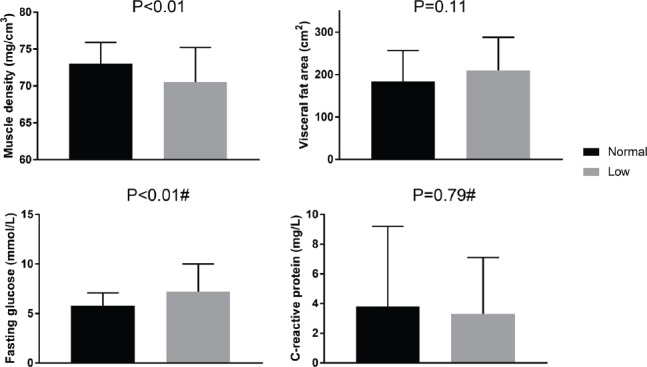
Comparisons of calf muscle density, visceral fat area, fasting glucose and C-reactive protein levels between groups stratified by low (≤9) or normal (>9) SPPB scores. #Mann-Whitney test for difference between groups, others are independent samples t-tests.