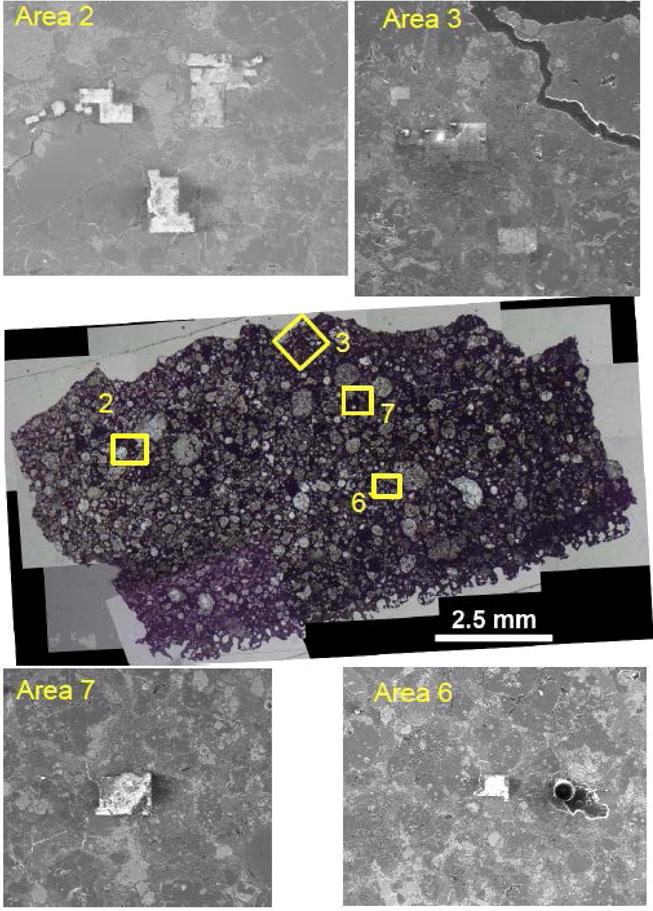
Figure 1.

Reflected-light (center) and secondary electron (SE, top and bottom) images of DOM 08006 thin section. The yellow boxes and SE images indicate areas analyzed by NanoSIMS (Table 1). NanoSIMS raster areas are clearly visible in the SE images.
