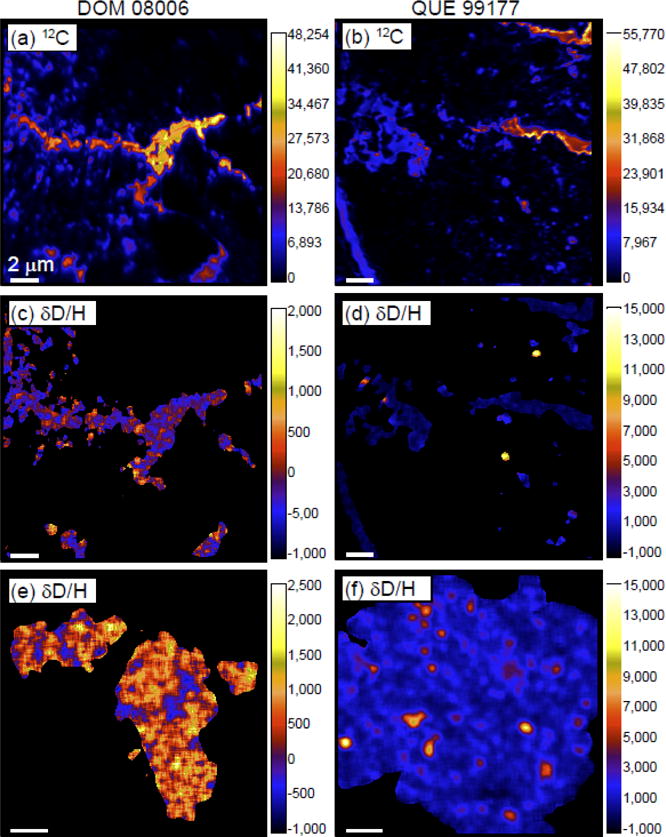
Figure 12.

NanoSIMS images of DOM 08006 (left) and QUE 99177 (right). (a) and (b) 12C ion images; units are counts per second. (c) and (d) In situ δD images; units in ‰. (e) and (f) Purified IOM δD images; units in ‰. Note the similar intensity scales for 12C images but much wider scales for δD in the QUE 99177 data compared to the DOM 08006 data. The apparent isotopic variations in (c) and (e) are not statistically significant. QUE 99177 in situ data were acquired previously with the Carnegie NanoSIMS under similar conditions to those reported here for DOM 08006. Scale bars are 2 μm.
