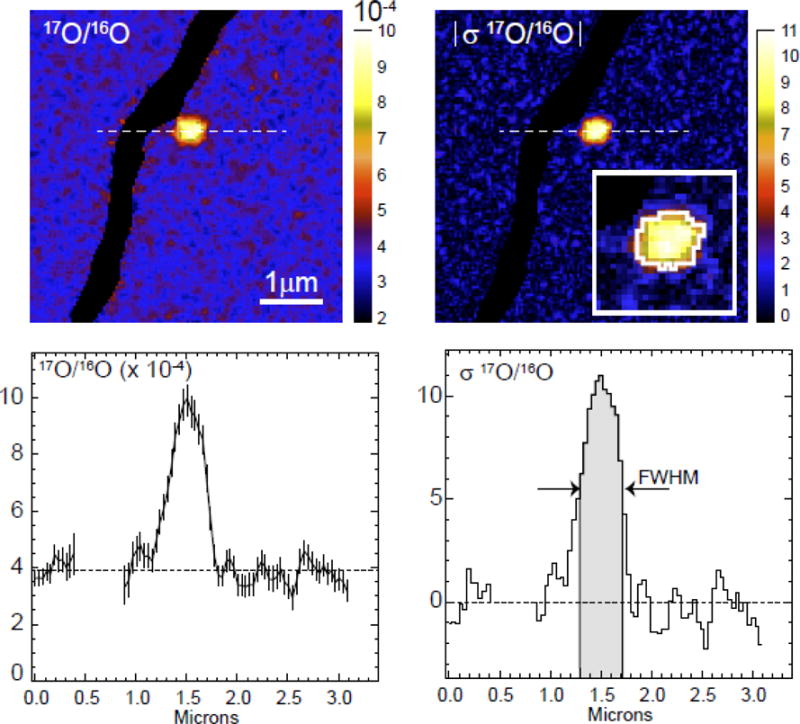
Figure 2.

Left: 17O/16O ratio image and line profile data for pixels indicated by dashed line for presolar grain DOM-80. Data are smoothed with a 3-pixel boxcar, such that the ratio and error bar for a given pixel are calculated from the total counts of that pixel and its two surrounding ones. Right: corresponding “sigma” image (color scale is absolute value) and line profile, where value in each pixel is difference (in standard deviations) of measured 17O/16O ratio relative to terrestrial composition. Only pixels with values that lie within the full width at half maximum (FWHM) of the isotopically anomalous region are included in definition of the presolar grain ROI (grey area in profile plot and outline in inset).
