Figure 3.

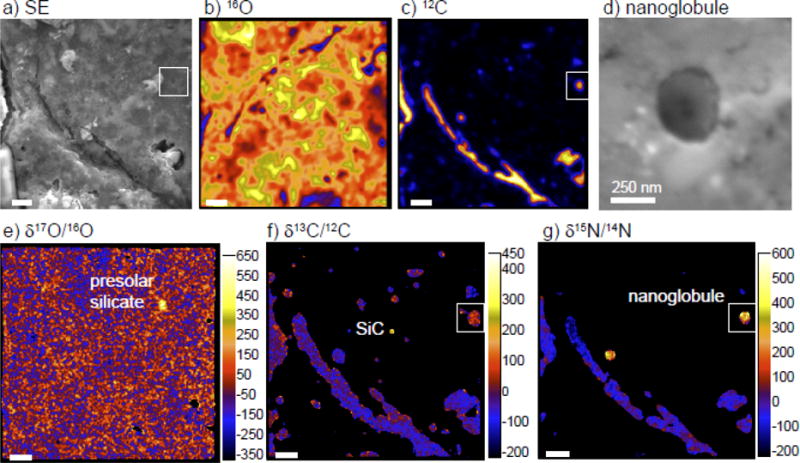
Example SEM and NanoSIMS images of one 10 × 10 μm area of DOM 08006. (a) SEM secondary electron image; (b) NanoSIMS 16O ion image; (c) NanoSIMS 12C image, (d) SEM secondary electron image of 13C- and 15N-rich organic nanoglobule, area marked by box in (a,f,g); (e) NanoSIMS δ17O/16O image with a 17O-rich presolar silicate (DOM-79, Table 2) indicated; (f) NanoSIMS δ12C/13C image with a 13C-rich presolar SiC indicated; and (g) NanoSIMS δ15N/14N image with two clear “hotspots” of enhanced 15N abundance, one of which corresponds to the nanoglobule in panel (d). Unless otherwise noted, scale bars are 1 μm. Delta values are deviations from a standard ratio in permil, defined as: δR=(Rmeasured/Rstandard − 1) ×103
