
Figure 7.
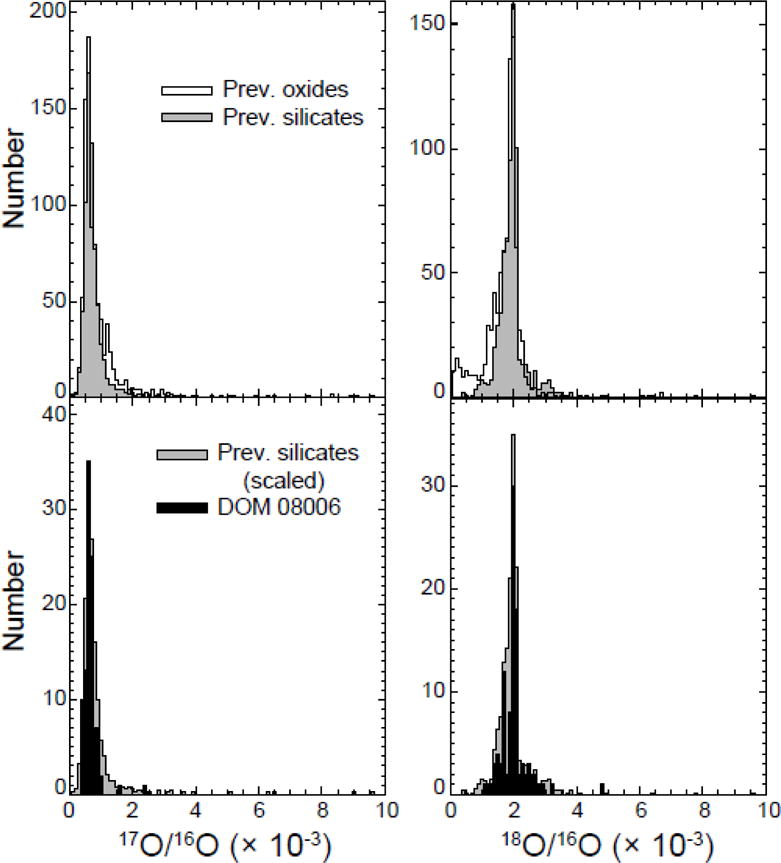
Histograms of O isotopic ratios measured in presolar oxide and silicate grains (see Figure 6 for data sources). Top: Previously reported data for silicates and oxides are compared; presolar silicates show a narrower distribution of 17O/16O and 18O/16O ratios than presolar oxide grains, reflecting isotope dilution in in situ SIMS analyses. Bottom: Data for 101 DOM 08006 presolar grains compared to the previous silicate data (re-scaled to fit on plots). The DOM 08006 data span narrower ranges of O-isotope ratios, most likely reflecting both the limited statistics as well as a conservative choice for identifying grains in ion images (see text).