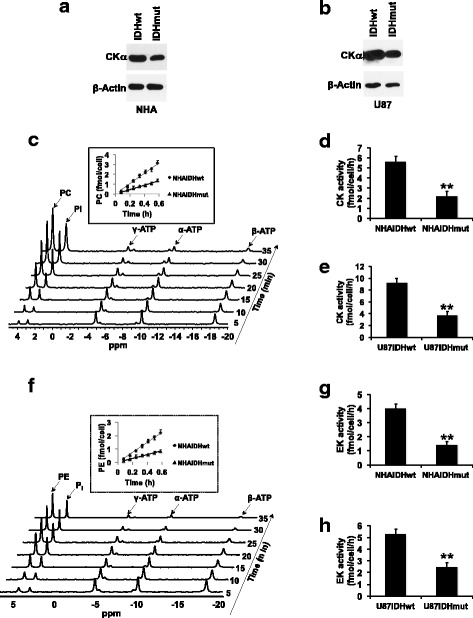
Fig. 2.

CK activity and EK activity are downregulated in IDHmut glioma cells. CKα expression in the NHA (a) and U87 (b) models. c Representative 31P-MR assay for CK activity showing PC build-up following addition of cell lysate to a reaction mix containing choline and ATP. The inset shows the rate of PC production in the NHA model. Quantification of CK activity in the NHA (d) and U87 (e) models. f Representative 31P-MR assay for EK activity showing PE build-up following addition of cell lysate to a reaction mix containing ethanolamine and ATP. The inset shows the rate of PE production in the NHA model. Quantification of EK activity in the NHA (g) and U87 (h) models
