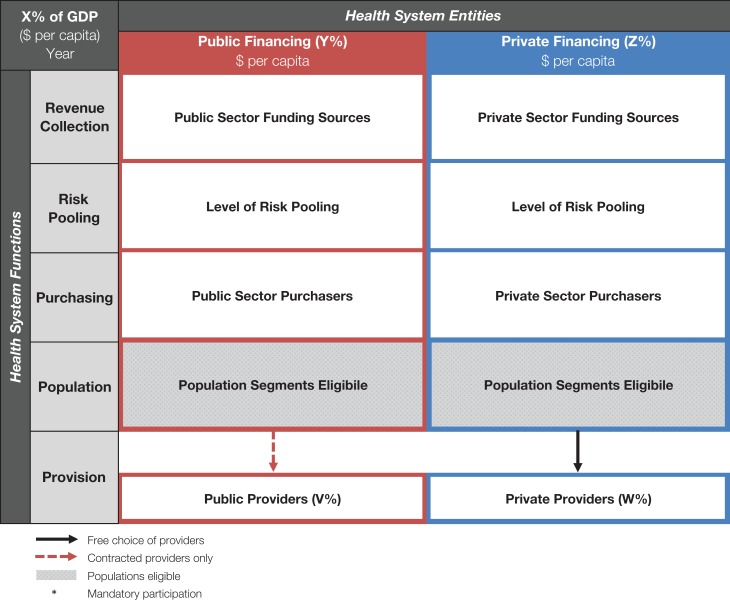
Figure 2.
Basic structure of University of California, San Francisco (UCSF) Healthcare Systems Mapping Tool. Health system entities fall along the horizontal axis. The vertical axis represents the functions of these entities. Gray shading shows the populations eligible. X, Y, Z, V, and W should be filled in with the relevant numbers for the country. For ease of comparison between countries, we use US$. GDP: gross domestic product.

