Figure 6.
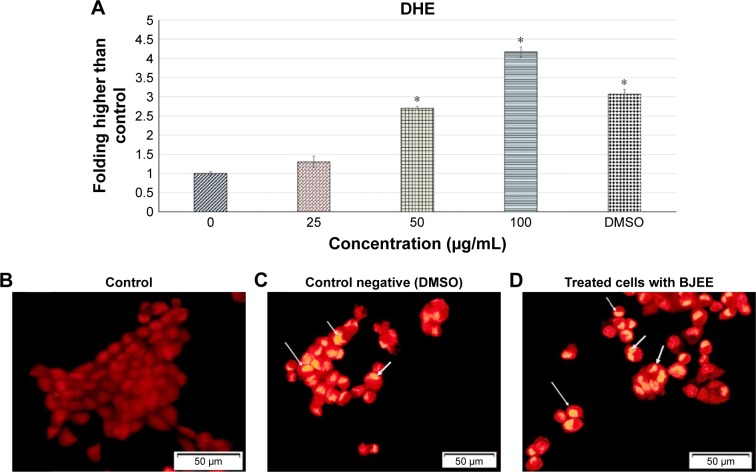
ROS production in the presence of BJEE in HT29 cells.
Notes: Bar chart represents quantification of DHE fluorescence intensity at different treatment concentrations (0, 25, 50, and 100 µg/mL) (A). DHE fluorescence folding increased at higher concentrations of BJEE treatment. Untreated HT29 cells stained with DHE (B). The yellow staining of nuclei reflects the intracellular generation of ROS. A large number of HT29 cells showed intense staining for ROS (arrows) after dimethyl sulfoxide treatment (control negative) (C), and this reaction was developed in HT29 cells treated with BJEE for 12 h (D). A significant formation of ROS observed in treated HT29 cells with BJEE. Data are expressed as the mean ± SD of triplicate measurements. *p<0.05 compared with the no-treatment group, magnification: 200×.
Abbreviations: BJEE, Brucea javanica ethanolic extract; DHE, dihydroethidium; ROS, reactive oxygen species.

