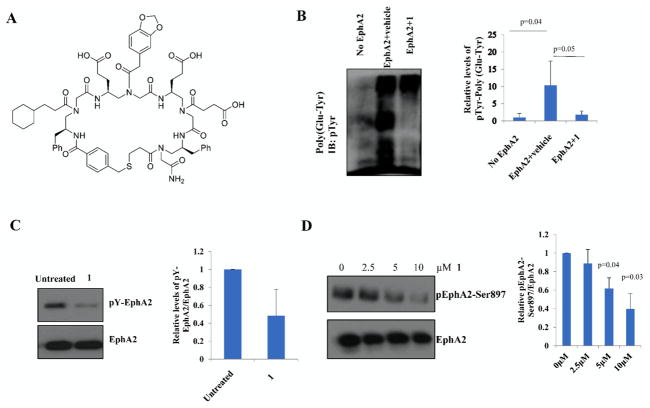
Figure 4.
(A) Structure of lead compound 1. (B) In vitro kinase assay was performed using 50 ng of EphA2 and 50 μg of poly(Glu-Tyr) as a substrate containing 2 μM 1. Quantification of substrate phosphorylation was shown. (C) Autophosphorylation of EphA2 was detected by incubating 50 ng of EphA2 with 2 μM 1 in the kinase assay buffer. Immunoblot analysis with pTyr antibody was performed. (D) C13 cells were treated with the indicated concentrations of 1 for 24 h. Immunoblot analysis of EphA2-Ser897 was performed. Total EphA2 was used as a control. The extent of phosphorylation was quantified using ImageJ software. Densitometric analysis was performed by SPSS.

