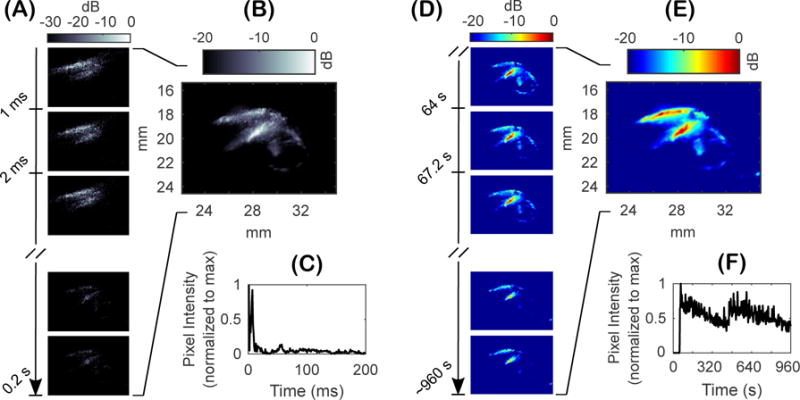
Figure 4.

In vivo monitoring of acoustic cavitation with passive cavitation imaging during blood-brain barrier (BBB) opening with focused ultrasound (FUS) and microbubbles. (A) High-frame rate (1000 Hz) acquisition of a 200 frame set of synchronous passive cavitation images processed using delay and sum (DAS) beamforming with absolute time delays. (B) Power cavitation image for the 200 frame set of passive cavitation images. (C) Pixel intensity over time for the set passive cavitation images at a (x,z) coordinate of (28 mm, 18 mm). (D) Individual power cavitation images from each 200 frame set of passive cavitation images acquired approximately every three seconds over the entire treatment duration. (E) The mean power cavitation image produced from 300 frames of power cavitation images. (F) Pixel intensity of the power cavitation image set at a (x,z) coordinate of (28 mm, 19.5 mm) over the treatment duration.
