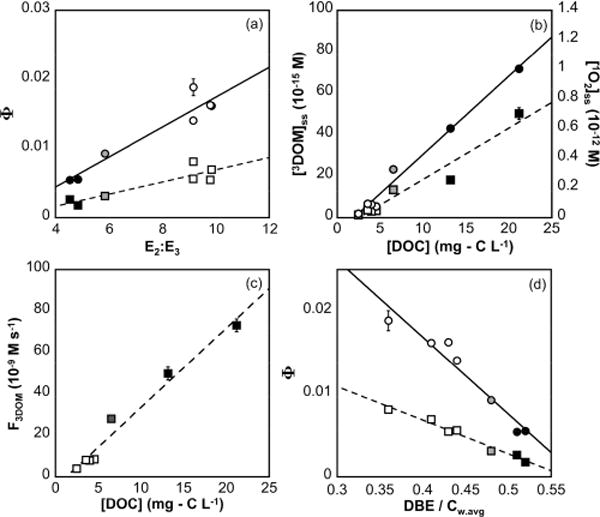
Figure 4.

(a) Quantum yields of 3DOM determined with HDA (Φ3DOM; square markers) and 1O2 with FFA (round markers) plotted versus E2:E3 where Φ3DOM = 0.00088 × E2:E3 − 0.00187 (r2 = 0.81)2 and Φ1O2 = 0.00216 × E2:E3 − 0.00424 (r2 = 0.91). (b) Steady-state concentrations of 3DOM (square markers) and 1O2 (round markers) plotted versus [DOC], where [3DOM]ss (×10−15 M) = 4.31 × [DOC] + 0.26 (r2 = 0.94) and [1O2]ss (×10−15 M) = 52.9 × [DOC] − 102.8 (r2 = 0.99). (c) 3DOM formation rate plotted versus [DOC], where F3DOM (×10−9) = 3.82 × [DOC] − 4.76 (r2 = 0.97). (d) Φ3DOM (square markers; r2 = 0.97) and Φ1O2 (round markers; r2 = 0.94) versus DBE/Cw.avg. Oligotrophic lakes are indicated with hollow markers, Allequash Lake is indicated with gray markers, and bogs are indicated with black markers. Error bars represent the standard deviation of triplicate analysis. Trend lines show linear, least-squares regressions.
