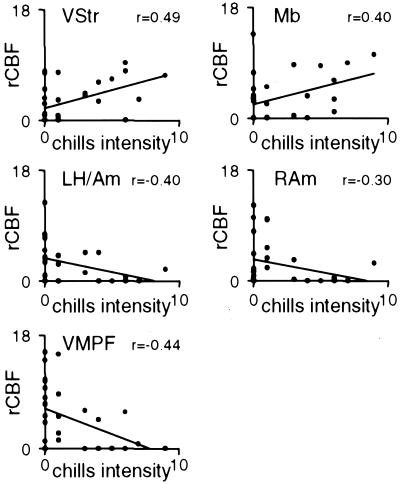
Figure 3.
rCBF versus subject ratings of chills intensity for regions significantly correlated with chills intensity (subject-selected music only). rCBF values were calculated from subject-selected music scans (10 subjects; 3 scans per subject) for left ventral striatum, left dorsal midbrain, left hippocampus/amygdala, right amygdala, and VMPF. rCBF was calculated for volumes of interest in a 5-mm radius around peak response coordinates reported in Table 1 and plotted here. Trendlines on each plot indicate a least squares fit. A Pearson correlation was used to calculate the correlation coefficient (r) for each region, which is displayed in the top right corner of each plot. VStr, ventral striatum; Mb, dorsomedial midbrain; LH/Am, left hippocampus/amygdala; RAm, right amygdala.

