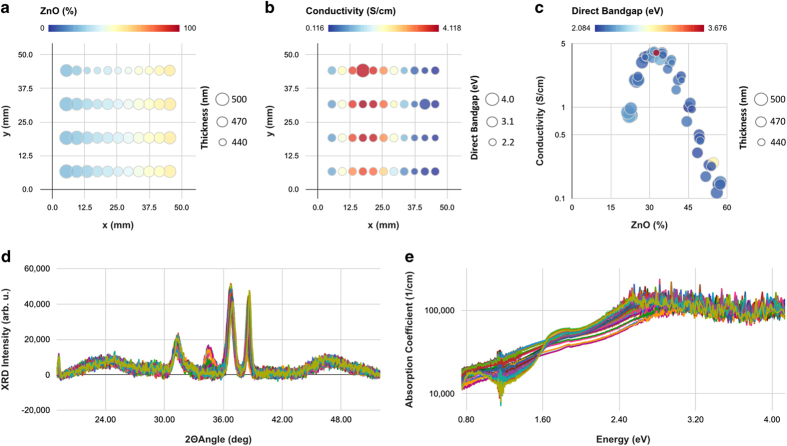
Figure 6. Example property and spectra plots in HTEM DB for one Zn-Ni-Co-O sample library.
Panel (a) is a composition (color) and thickness (size), panel (b) is conductivity (color) and its direct bandgap (size), both as a function of x and y position on the sample library. Panel (c) is the summary analysis plot of logarithm of conductivity vs composition, with direct band gap as a color scale, and thickness as point size. Panels (d) and (e) are the underlying x-ray diffraction patterns, and the optical absorption spectra, respectively.

