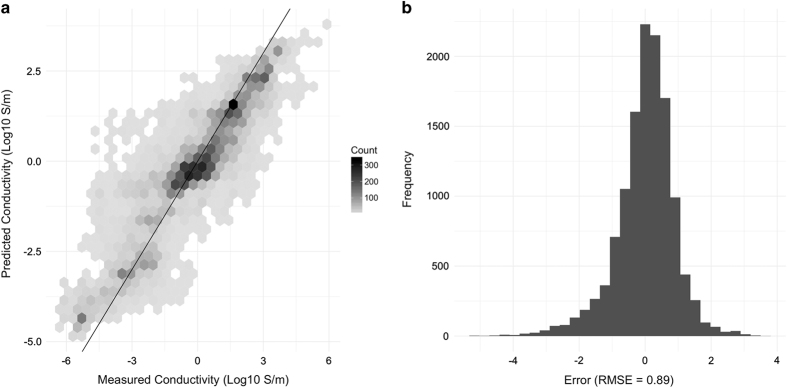
Figure 8. Performance of a Random Forest model for predicting material conductivity using measured composition.
(a) Hex-binned scatterplot showing predictions compared to 16,093 measured values using the final model from sample-based cross validation scheme. (b) Histogram of the same, showing an aggregate RMSE of 0.89 (log scaled) across the entire data. This performance should be considered as ‘best case’ compared to the performance from other training datasets and other cross-validation schemes given in Table 1.

