Figure 4.
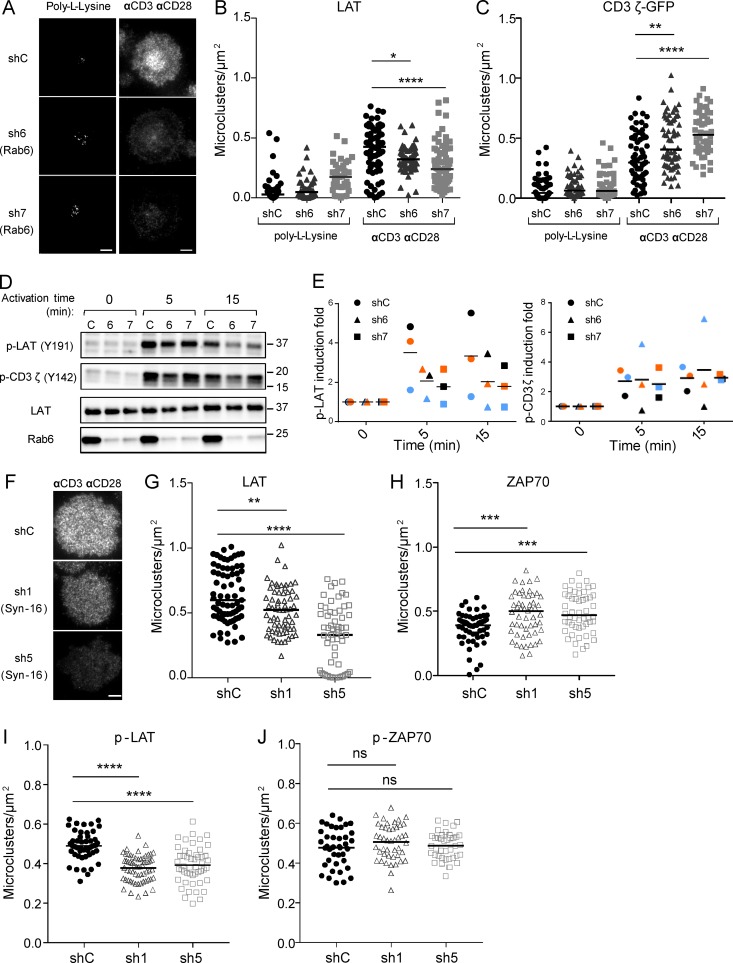
Rab6 and Syntaxin-16 control LAT microcluster formation at the immune synapse and LAT phosphorylation. (A) TIRFM images of endogenous LAT in Jurkat cells expressing shC or Rab6-specific shRNA (sh6, sh7), incubated for 10 min on coverslips coated with poly-l-lysine alone (resting conditions) or anti-CD3ε+antiCD28 Abs (αCD3αCD28, activating conditions) before fixation and staining. (B) Quantification, in the evanescent field, of the density of LAT microclusters in Jurkat cells or (C) CD3ζ-GFP in Jurkat cells expressing CD3ζ-GFP. (D) Immunoblot analysis of phospho-LAT, phospho-CD3ζ, total LAT, and Rab6 in Jurkat cells expressing the different shRNA and activated for different times with anti-CD3ε+antiCD28 Abs. (E) Quantification of phospho-LAT and phospho-CD3ζ intensities, normalized on loading control, and expressed as fold increase of intensity at time 0. (F) TIRFM images of LAT in Jurkat cells expressing shC or Syntaxin-16–specific shRNA (sh1, sh5). (G–J) Quantification of the density of microclusters of LAT (G), ZAP70 (H), phospho-LAT (I), and phospho-ZAP-70 (J) in Jurkat cells, expressing control and Syntaxin-16–specific shRNA, activated for 10 min on coverslips coated with anti-CD3ε+antiCD28 Abs. *, P < 0.05; **, P < 0.01; ***, P < 0.001; ****, P < 0.0001 (one-way ANOVA). Median is represented by horizontal lines except in E, where mean is presented. All data are from two independent experiments, except for A, B and G, three independent experiments, and in E, three independent experiments each represented by one color. Bars, 5 µm.

