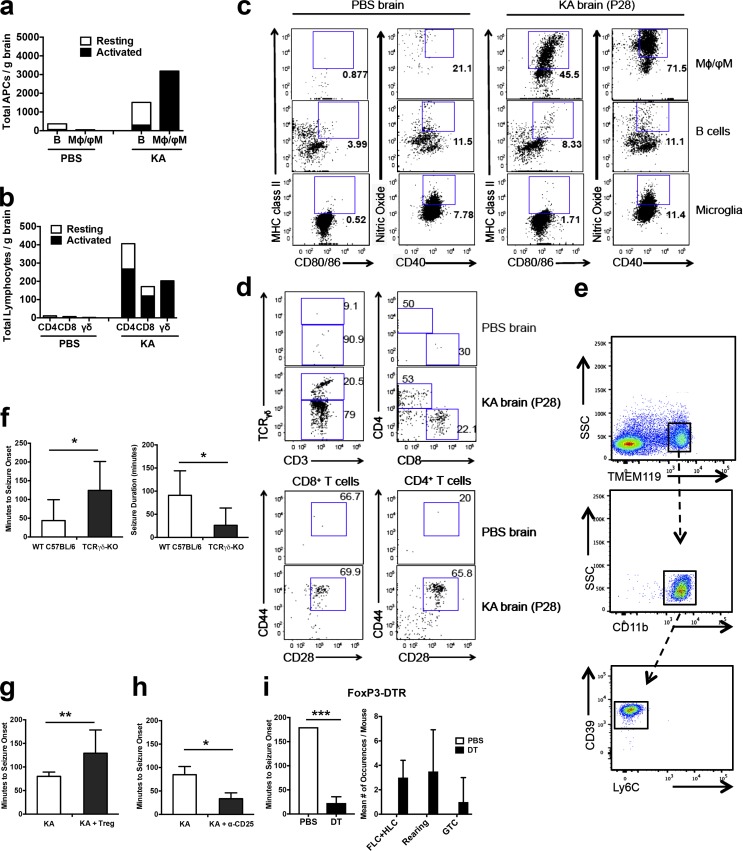
Figure 5.
Characterization of innate and adaptive immune effector and regulatory T cells in the mouse model of KA-SE. (a–d) Numbers (a and b) and frequencies (c and d) of resting and activated brain-infiltrating APCs (a and c) and T cells (b and d) in single-hit KA injected WT C57BL/6 mice (pooled from six mice). Three independent repeats were performed. (e) CD11b+Ly6C−CD39+ microglia costained for TMEM119, a novel microglia-specific marker for both human and mouse. Three independent repeats were performed. (f) Seizure onset latency and duration measured in single-hit KA injected wt C57BL/6 versus γδ T cell KO mice. Data represents a total of eight mice of each strain pooled from three separate experiments. (g) Seizure onset measured immediately after the second-hit of KA in unmanipulated (KA) and T reg cells supplemented (KA + T reg) C57BL/6 mice (n = 11 each) pooled from two separate experiments. (h) Unmanipulated (KA) and T reg cell–depleted (KA + α-CD25; n = 6 each) C57BL/6 mice 14 d after the first-hit of KA pooled from two separate experiments. (i) Seizure onset and frequency of seizure behavior measured immediately after the second-hit of KA in DT-injected (n = 4) and control (PBS, n = 3) FoxP3-DTR-eGFP mice. Data were pooled from two separate experiments. HLC, hind-limb clonus; FLC, fore-limb clonus; GTC, general tonic-clonic seizure, Mφ, macrophage; ϕM, inflammatory monocytes. Data are represented as means ± SD. *, P < 0.05; **, P < 0.01; ***, P < 0.001. P-values calculated using Student’s t test.

